Shifts in time on the Doomsday Clock

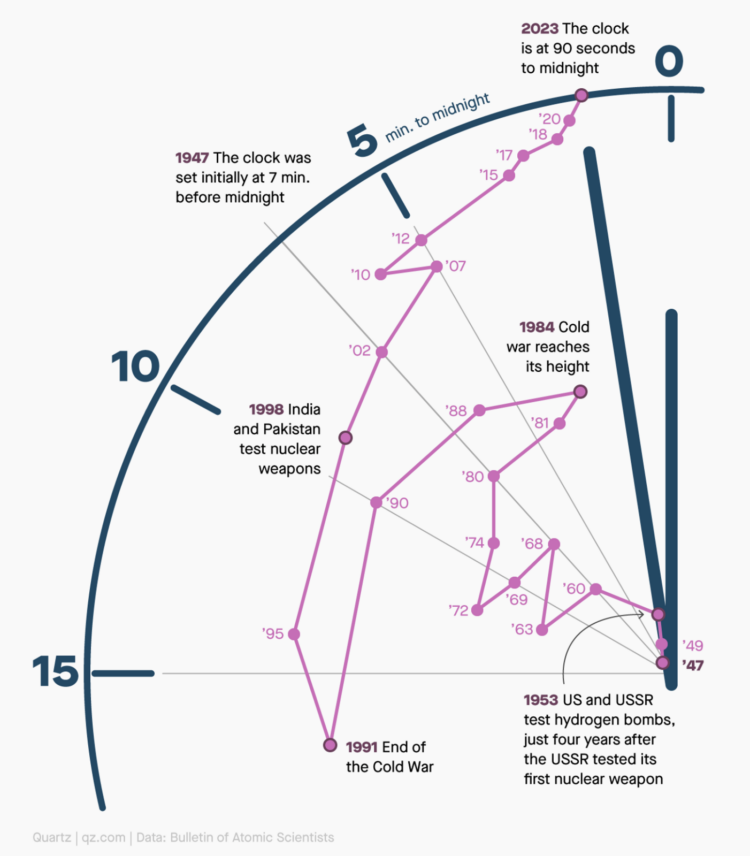
The Doomsday Clock is a metaphorical clock that symbolizes a catastrophic end to the planet due to human self-destruction. Midnight represents an event and the time represents the “minutes” away from the event. The numbers are fuzzy, as you might imagine. In any case, Amanda Shendruk for Quartz used a connected scatterplot on a clock view to show how the “estimate” has changed since 1947.

Tags: , ,

Immigration in the United States visualized as rings of tree trunk

Pedro M. Cruz, John Wihbey, Avni Ghael and Felipe Shibuya from Northeastern University used a tree metaphor to represent a couple centuries of immigration in the United States:

Like countries, trees can be hundreds, even thousands, of years old. Cells grow slowly, and the pattern of growth influences the shape of the trunk. Just as these cells leave an informational mark in the tree, so too do incoming immigrants contribute to the country’s shape.

Feels real.

Tags: ,

Same money, different counting strategies

Condé Nast Traveler got 70 people from 70 different countries to count money on camera. Many times I found myself wondering, “Why would you ever do it like that?” There’s a metaphor for data and its interpretation somewhere in there.

Tags: ,

Interactive lets you fly through a software galaxy

Software galaxy

This is a fun one. Software Galaxies by Andrei Kashcha visualizes popular software package managers as interactive galaxies. Each node is a package and connections indicate dependencies between packages. Use the keyboard and mouse to explore the 3-D world, rotating and shifting through clusters in each galaxy. Mouse over nodes to see what you're looking at.

I don't know much about the makeup or structure of the package managers, but it's fun to fly around nevertheless. It feels like a game.

Find out more about the process or download the code on Github. [Thanks, Andrei]

Tags: , ,