Excel World Championship

The Microsoft Excel World Championship 2023 wrapped a couple weeks ago, and the three-hour final that was streamed is available for your viewing pleasure.

I know I should be focused on the clicking and dragging and the hot keys, but it’s all about the commentary for me. I watched in fascination, like watching competitive tag on ESPN8.

Tags: ,

Python is coming to Excel

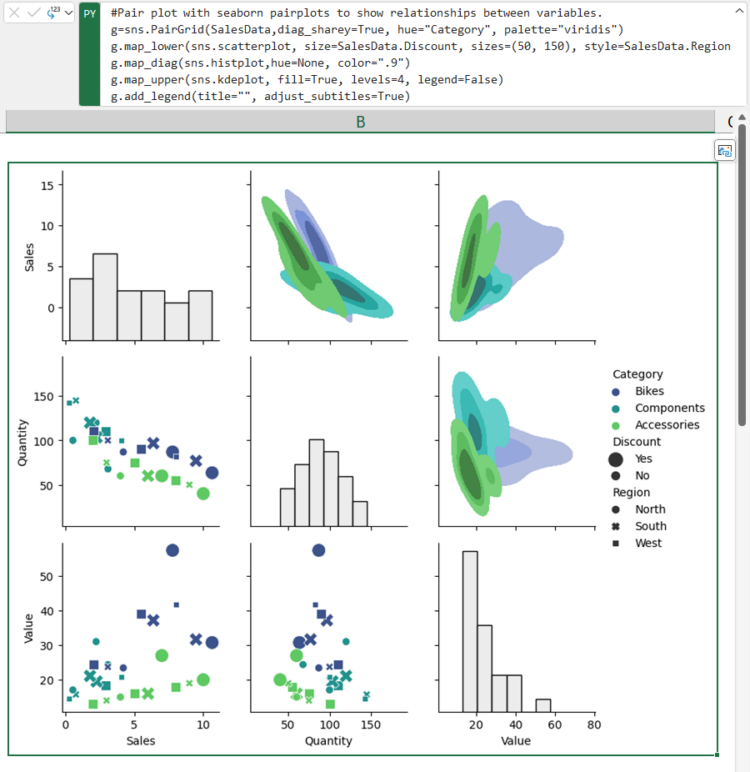
Excel is getting a bump in capabilities with Python integration. From Microsoft:

Excel users now have access to powerful analytics via Python for visualizations, cleaning data, machine learning, predictive analytics, and more. Users can now create end to end solutions that seamlessly combine Excel and Python – all within Excel. Using Excel’s built-in connectors and Power Query, users can easily bring external data into Python in Excel workflows. Python in Excel is compatible with the tools users already know and love, such as formulas, PivotTables, and Excel charts.

Sounds fun for both Excel users and Python developers.

It’s headed to the Beta Channel in Excel for Windows and then Excel for Windows proper. They didn’t announce a timeline for Mac.

Tags: ,

Spreadsheet esports

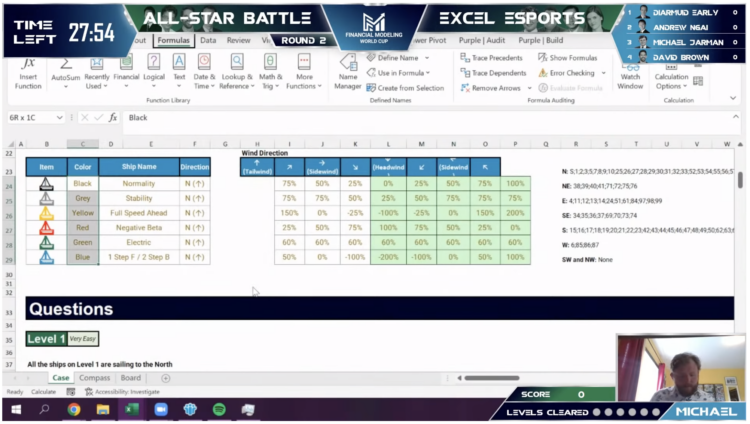
You’ve probably heard of esports, where people compete against each other in multiplayer video games. Financial Modeling World Cup runs esports for Microsoft Excel. Players get a fixed amount of time to accomplish complex spreadsheet tasks, and whoever figures out the correct answers in the least amount of time wins.

The two-hour all-star battle last year even had running commentary and post-competition interviews. It is so gloriously nerdy. [via kottke]

Tags: ,

Charting software that pre-dates Excel

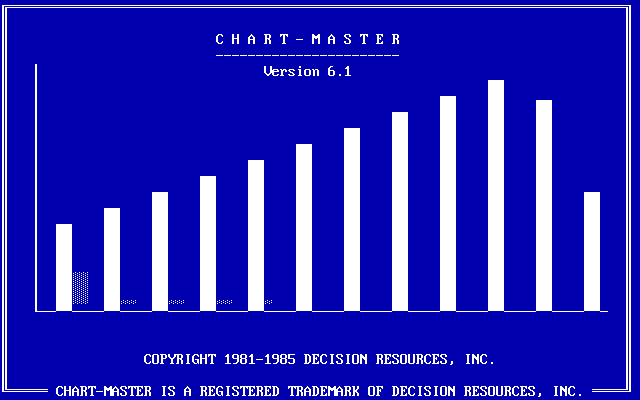
RJ Andrews digs up the PC archives of charting software. Scrolling through the thread, you can see the roots of Excel in the software that pre-dates the 1987 Windows release, along with what was considered nice back in the day. In many ways, such as in the interface, features, and chart types, things haven’t changed that much over the past few decades.

Tags: , ,

Excel spreadsheet limit leads to 16,000 Covid-19 cases left off daily count

Microsoft Excel is useful for many things, but it has its limitations (like all software), which led to an undercount of 15,841 Covid-19 positive tests recorded by Public Health England. For the Guardian, Alex Hern reports:

In this case, the Guardian understands, one lab had sent its daily test report to PHE in the form of a CSV file – the simplest possible database format, just a list of values separated by commas. That report was then loaded into Microsoft Excel, and the new tests at the bottom were added to the main database.

But while CSV files can be any size, Microsoft Excel files can only be 1,048,576 rows long – or, in older versions which PHE may have still been using, a mere 65,536. When a CSV file longer than that is opened, the bottom rows get cut off and are no longer displayed. That means that, once the lab had performed more than a million tests, it was only a matter of time before its reports failed to be read by PHE.

The gut reaction seems to dunk on Excel, but the whole infrastructure sounds off. Excel wasn’t meant to handle that many rows of data, and as a non-Excel person, I think it’s been like that forever.

Why are these records manually entered and transferred to a database? Why is the current solution to work off this single file that holds all of the data?

I bet the person (or people) tasked with entering new rows into the database aren’t tasked with thinking about the data. Who eventually noticed no new records were recorded after a week?

Such important data. So many questions.

It’s not so much an Excel problem as it is a data problem, and what looked like downward trend was actually going up.

Tags: , ,

“Take On Me” by a-ha recreated in Excel

Dylan Tallchief recreated “Take On Me” by a-ha in Excel.

It’s not the tools. It’s how you use them. Something something blah blah. It’s in Excel!

Tags: , ,

Making stupid Excel bar charts

I’m just gonna put this right here, from @_daviant: “Another day another stupid Excel chart”.

Tags: ,

Cleaning your data with Excel and Google Spreadsheets

For Datawrapper, Lisa Charlotte Rost outlines the steps to prepare and clean your data in Excel or Google Spreadsheets. From the beginning:

When you download an Excel file, it often has multiple sheets. Our data set has three of them, as seen on the bottom: “Data”, “Metadata – Countries” and “Metadata – Indicators”. Look through all of your sheets and make sure you understand what you’re seeing there. Do the headers, file name and/or data itself indicates that you downloaded the right file? Are there footnotes? What do they tell you? Maybe that you’re dealing with lots of estimates? (Does that maybe mean that you need to look for other data?) If you don’t find notes in the data, make sure you look for them on the website of your source.

The guide is in the context of prepping your data to load into the Datawrapper tool, but the advice easily applies more generally.

Tags: , ,

R data structures for Excel users

Introducing yourself to R as an Excel user can be tricky, especially when you don’t have much programming experience. It requires that you switch from one mental model of the data that exists in an interactive spreadsheet to one that exists in vectors and lists. Steph de Silva provides a translation of these data structures for Excel users.

Tags: ,

Posted by in Coding, Excel, R

Tags: ,

Permalink

Microsoft Excel painter

Remember the artist Tatsuo Horiuchi who uses Microsoft Excel to paint scenery? Four years later, he’s still at it. Watch below.

Horiuchi is my favorite example of someone who shows that the tool is secondary to what you want to make. Spend less time debating about what software you should use to visualize your data, and spend more time deciding what you want to show.

Tags: , ,