How you might vote based on what you like

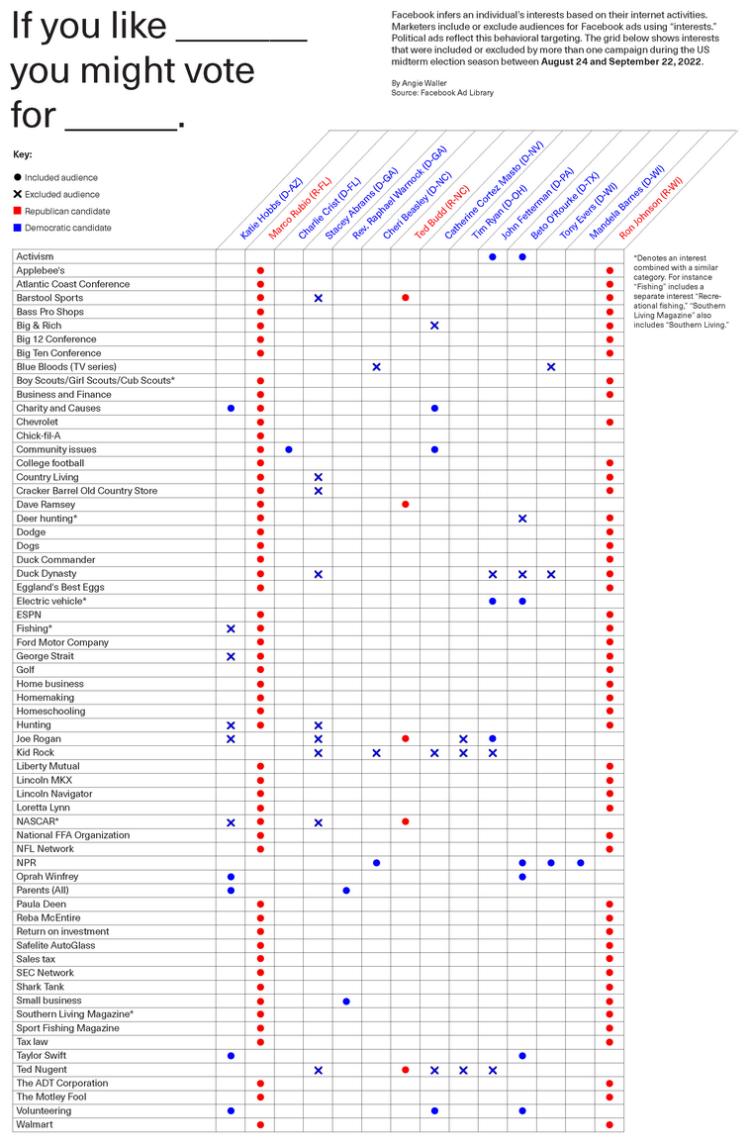
By Angie Waller, this table shows how Facebook thinks you’ll vote based on what you like. It’s a straightforward view that’s fun to look at. In particular, I like the excluded audiences for certain topics marked with an x.

I often see ads that are completely unrelated to my interests, and a small part of me feels like I’m winning in some way, even though I’m almost definitely losing.

Tags: , ,

All the elections where you live

We tend to talk about elections as this uniform thing. People vote for some other people. But who we vote for, who we vote with, and when we vote for who varies depending on where you look. USAFacts mapped all the different communities for the upcoming midterm elections, so you can see the elections where you are. Select other places and compare.

I played a small part on the data side of this project. Pulling data from a mixed bag of sources and linking them over consistent time and geography was a fun challenge.

Tags: , ,

Contrasting social media Democrats to real life

As many know (I hope), what we see on social media often doesn’t mirror real life. It’s a filtered and algorithmically-driven point of view. This grows problematic when people make decisions based solely on what they see through their feeds. For The Upshot, Nate Cohn and Kevin Quealy look at the contrasts between the filtered view and the real life view and how it factors into voting.

Tags: , ,

Higher turnout for midterm elections

Bloomberg charted voter turnout for the just past midterm elections, comparing 2018 against 2014. As you might expect, there are a lot of blue arrows pointed up and to the left. Turnout decreased in only two districts.

Tags: ,

Statistics lesson on polling

Nate Cohn for the Upshot provides a statistics lesson in the context of election forecasts and why they differ so much.

[P]ollsters make a series of decisions when designing their survey, from determining likely voters to adjusting their respondents to match the demographics of the electorate. These decisions are hard. They usually take place behind the scenes, and they can make a huge difference.

To make the point, the Upshot gave four pollers the same raw data to interpret. Results varied.

Tags: , ,

Grid map shows shifting states

Time series grid map

You’re likely familiar with the state grid map form used these days. Instead of using geographic boundaries, you place states in a grid layout, giving an equal-sized cell to each state so that they all get the same visual weight. The Wall Street Journal combined it with a time series for each state in their field guide to shifting states.

The country is more than just red states and blue states. Some former battlegrounds have moved to the sidelines. Other once reliably Republican or Democratic states have come into play as the composition of their electorates change.

Red means more Republican than the national popular vote, and blue means more Democrat.

The slow, animated load makes the map. It reminds me of the New York Times’ “wind” map from the previous election. Life-like.

Tags: ,

Track what your government representatives are doing for you

Represent app from ProPublica

Taking over an old New York Times project, ProPublica re-launches Represent, which offers an app and an API to see what your local lawmakers have been doing on your behalf.

Represent will show details of votes and bills and provide a way for you to follow the activities of your elected representatives and understand how they fit into the broader world of American politics. For example, we’ll show you how often a member of the House or Senate votes against a majority of her party colleagues, or the kinds of bills each lawmaker sponsors and cosponsors. We have pages detailing every vote, every bill and every member, with details about each. On the homepage we’ll display significant votes in the House and Senate.

If we’ve learned anything from this current election season, it’s that we should pay attention, stay educated, and vote accordingly.

Tags: , , ,

Balance the Trump and Cruz tax plans

Trump and Cruz budget cutsThe tax plans of Ted Cruz and Donald Trump might seem fine if you don’t think about the actual values. Tax cuts. Less government spending. But then it gets tricky when you look at what they’re actually proposing. Alvin Chang for Vox provides a simple interactive to show what the Cruz and Trump and budgets require.

They want to cut so much government spending that it’s virtually impossible to figure out how they’d do it. Cruz wants to cut spending by $8.6 trillion over the next decade, according to a Tax Policy Center analysis, and Trump wants to cut it by $9.5 trillion. To put this in perspective, the entire budget for this fiscal year is $3.9 trillion.

Be sure to go to the bottom to try to balance the the budgets yourself.

Tags: ,

Super Tuesday simulation to show uncertainty

Super Tuesday simulation

As we know, there are various outcomes during election season, with uncertainty in each round. The Upshot is currently using a simulation to show the expectations of tonight.

These estimates, which include states that have not yet reported all their votes, are based on several factors: Our expectations of every candidate’s performance, the voting results in other states and the demographic makeup and historical voting patterns of voters in each state. As votes come in, we expect the uncertainty around our estimates will narrow.

Nice.

Tags: , , ,

Possible paths for a Trump nomination loss or win

How Trump can win

It pains me to imagine a time when Donald Drumpf earns a Republican nomination. There are a number of ways he can get there, but there are a number of ways Marco Rubio can win the nod too. The Upshot simulated the possible routes.

To figure out what it will take for Donald J. Trump — or Marco Rubio or Ted Cruz — to win the Republican nomination, we built the G.O.P. presidential nomination process in code. This interactive delegate calculator uses each state’s delegate allocation rules, along with estimates of how favorable each district is for each candidate, to simulate how the race might unfold.

And if you have a different idea of what the results will be like, you can adjust the sliders for each candidate to simulate your own results.

Tags: , , ,