How the demographics of your neighborhood changed

The San Francisco Chronicle compares demographics in your neighborhood in 2020 against 2010. It’s a straightforward app that lets you enter an address (not just in California) and it shows you the changes at several geographic levels.

I like how snappy it is when you enter an address.

Tags: , ,

More detailed data release from Census 2020

After a lot of angst over the past few years around undercount, representation, and anonymization, the Census Bureau released detailed data from the 2020 decennial census:

The U.S. Census Bureau today released additional 2020 Census results showing an increase in the population of U.S. metro areas compared to a decade ago. In addition, these once-a-decade results showed the nation’s diversity in how people identify their race and ethnicity.

“We are excited to reach this milestone of delivering the first detailed statistics from the 2020 Census,” said acting Census Bureau Director Ron Jarmin. “We appreciate the public’s patience as Census Bureau staff worked diligently to process these data and ensure it meets our quality standards.”

These statistics, which come from the 2020 Census Redistricting Data (Public Law 94-171) Summary File, provide the first look at populations for small areas and include information on Hispanic origin, race, age 18 and over, housing occupancy and group quarters. They represent where people were living as of April 1, 2020, and are available for the nation, states and communities down to the block level.

Tags: ,

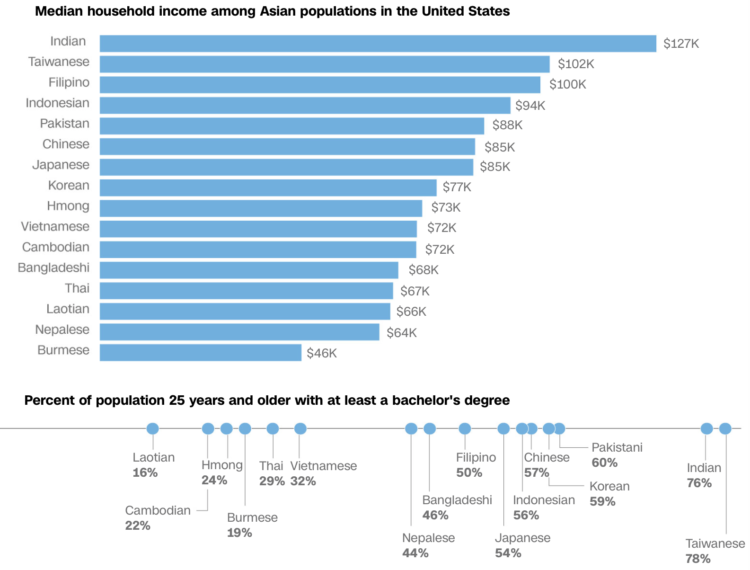
Varying demographics within the Asian American population

We often hear about the Asian American community as one big group of people, but go one level down and you see a lot of variance within the group. Nicole Chavez and Priya Krishnakumar, reporting for CNN, provide several demographic breakdowns to show the differences.

Tags: , ,

Gaps between black and white America

New York Times Opinion compared several demographics, such as unemployment and income, between majority-black and majority-white neighborhoods in the United States.

They come back to the zipper chart technique where the dots start together and then separate to emphasize the gaps. Horizontally, dots are sorted by smallest to largest difference.

Tags: , ,

Predicting whether you are Democrat or Republican

The New York Times is in a quizzy mood lately. Must be all the hot weather. Sahil Chinoy shows how certain demographics tend towards Democrat or Republican, with a hook that that lets you put in your own information. A decision tree updates as you go.

Reminds of the Amanda Cox decision tree classic from 2008.

Tags: , , , , ,

Demographic effects on voting intention

The Economist built an election model that treats demographic variables like blocks that output a probability of voting Republican or Democrat:

Our model adds up the impact of each variable, like a set of building blocks. As a result, a group of weak predictors that point in the same direction can cancel out a single strong one. In theory, the model could identify a black voter as a Republican leaner, or a white evangelical as a probable Democrat—though it would require quite an unusual profile.

Remember when most people paid little attention to midterm elections and result forecasting was not really a thing? Yeah, me neither.

Be sure to check out the small interactive on the same page that lets you “build a voter” and get the model’s probability output. I’m a fan of the demographic-field-dropdowns-in-a-sentence format.

Tags: , ,

Mapping opportunity for children, based on where they grew up

Opportunity Atlas, a collaboration between Opportunity Insights and the Census Bureau, is the product of ongoing research on the demographics of people, based on the neighborhood they grew up in.

The Opportunity Atlas provides data on children’s outcomes in adulthood for every Census tract in the United States through an interactive map providing detailed research on the roots of these outcomes, such as poverty and incarceration rate, back to the neighborhoods in which children grew up. This tool will enable policy makers, practitioners, and the public the unprecedented ability to look within their city to understand better where opportunity exists and how each neighborhood shapes a child’s future economic and educational success.

The map application was developed by Darkhorse Analytics. Zoom in to an area of interest, subset on demographics such as income level, race, and gender, and see how the people who grew up in those areas fared later in life. You can also download the tract-level data to look for yourself.

Tags: , , ,

Cities like yours

There are many ways to estimate how similar two cities are — weather, demographics, taxes, etc. Jed Kolko from job site Indeed and Josh Katz for The Upshot used the distribution of job offerings. Just enter your city or a nearby metro, and you get something like this:

I punched in cities I’ve lived in or visited, and the results looked pretty good.

The analysis is based on job postings on Indeed, but I wonder if this would work with Census data. And can we apply this similarity index or some form of it to, say, individuals? Just think of the possibilities, Match.com.

Tags: , ,

Income mobility for different groups

Building on their previous visualization work on black boys dropping income levels in adulthood, The Upshot adds the option to change demographic groups. See income mobility for different races, genders, and income starting points.

Tags: , ,

Alabama voter demographics

Democrat Doug Jones won in the senate race against Republican Roy More last night. The Washington Post provides how different demographic groups voted, based on a poll “conducted by Edison Research for the National Election Pool, The Washington Post and other media organizations.”

Tags: , ,