Scale model of the universe’s timeline

To better understand the scale of time and feed your existential dread, Wylie Overstreet and Alex Gorosh used LED lights spread miles across a desert, proportional to milestones in the history of the universe. The model stretched 4.3 miles to represent 13.8 trillion years.

See also the seven-mile scale model of the Solar System, which is another video in their To Scale series. [via kottke]

Tags: , , ,

Shortening baseball games

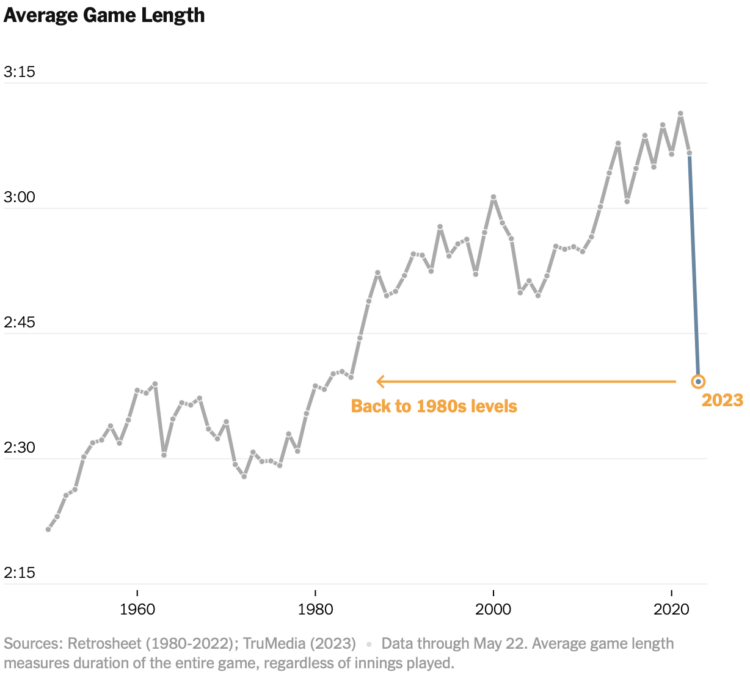
Baseball games grew longer over the decades, with the average length well over three hours in recent years. Ben Blatt and Francesca Paris, for NYT’s The Upshot, show how a few rule changes this season keep the ball moving for shorter games.

Tags: , ,

Word cloud + Streamgraph = WordStream

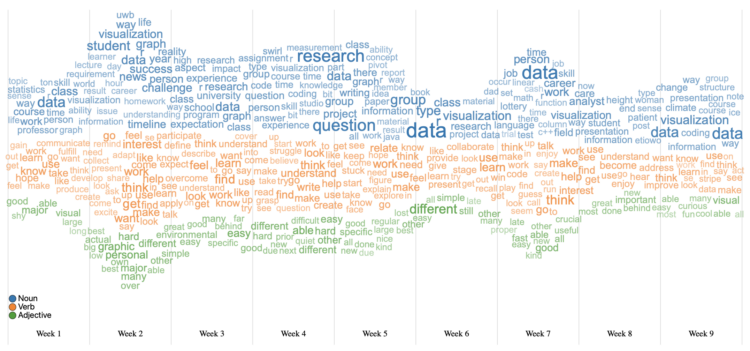
I hear it all the time from chart purists. “I love the streamgraph!” and “Word clouds are the best!” and “I wish there was an easy way to combine a streamgraph and word cloud to see textual changes over time, because that would be ultimate!” Lucky for you, WordStream by Tommy Dang, Huyen N. Nguyen, and Vung Pham combines the best of both worlds.

They released the work a few years ago, but now it comes as an interactive tool on the web. Upload your comma-delimited file with time and text columns and you get a chart. Adjust sizes, parts of speech, and the metrics you want to represent for the ultimate words over time.

All it needs is an export button and research papers may never be the same.

Tags: ,

Tree Talk

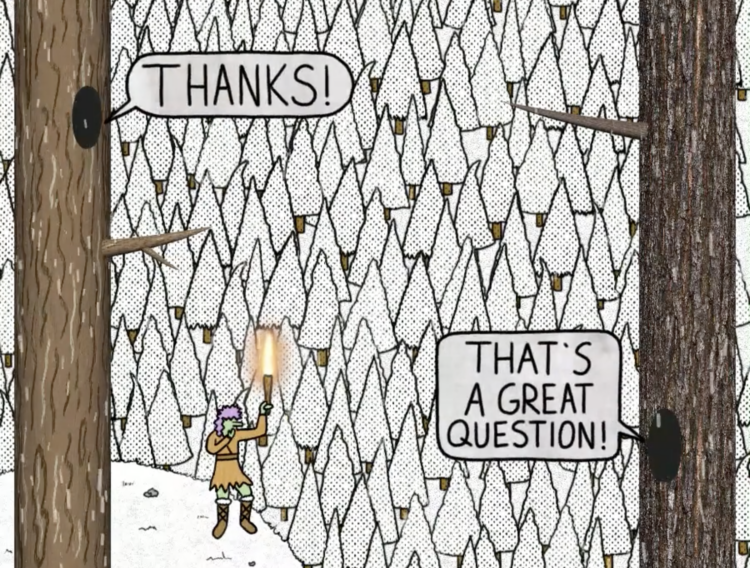
Kelton Sears used a vertical scroll upwards to think about trees and time.

Tags: , , ,

Visualizing time-based data

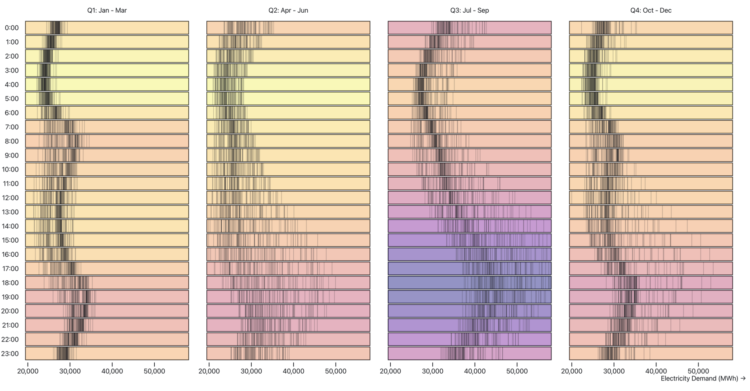
Zan Armstrong, Ian Johnson, and Mike Freeman for Observable wrote a guide on analyzing time series data. Using an energy dataset, they show how asking different questions can lead to different findings and visualizations:

These are stories about analyzing data that changes over time. While most of us don’t dig into data about energy day-to-day, we hope the feel of this data and these questions will be familiar to anyone who regularly faces questions like “what changed?”, “what happened?”, “was that normal?”, “what is typical?”, and “did things go as expected?” We hope that this will spark an idea about how to look at your own data in a new way.

I will never tire of the multiple-views-from-the-same-dataset teaching device.

Tags: , ,

2020 Progress Bars

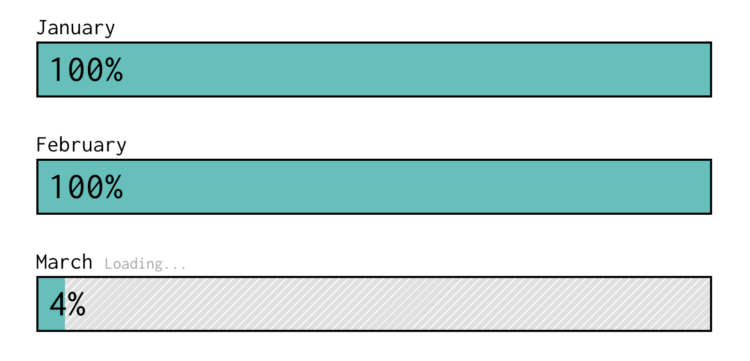
I thought March was only 31 days, but the system seems stuck. Did anyone try turning it off and on again. Read More

Why time feels weird right now

For Reuters, Feilding Cage provides a series of interactive tidbits to demonstrate why time perception feels like a mess these days.

Various factors skew our perception different directions. On emotion:

A busy day usually goes by quickly, but for some the opposite is true in 2020. Frontline healthcare workers, for example, know they are at high risk of exposure to the coronavirus, and the resulting anxiety heightens their attentiveness and slows their perception of how quickly a day passes.

For others, however, time can fly during joyful moments, such as a video catch-up or dinner with friends.

There’s nothing on why it feels like time is moving backwards though.

Tags: , ,

Game of Distraction

They say a watched pot never boils. So here's a game where you try to make the pot boiling by looking somewhere else. Read More

Test how well you can draw the states

Chris Wilson for Time has a fun piece up that tests how well you can draw the states. The quiz asks you to draw the states, and you get a grade for each sketch. Your sketched states are then placed geographically on a map so you can see how horrible you are.

Tags: , ,

Why time flies when you’re older

Why time flies

When you're a kid, a year seems like forever. Appending "and a half" to an age seems significant and necessary. But as you get older, the years seem shorter. Heck, I can't even remember how old I am half the time. Maximilian Kiener uses an interactive timeline to argue why this is. The more years you're alive, the lower the percentage a year actually is of your life. And eventually, one year is just a tiny sliver.

Tags: ,

Posted by in age, Infographics, time

Tags: ,

Permalink