✚ Chart Options for When Time Data Has Uneven Gaps

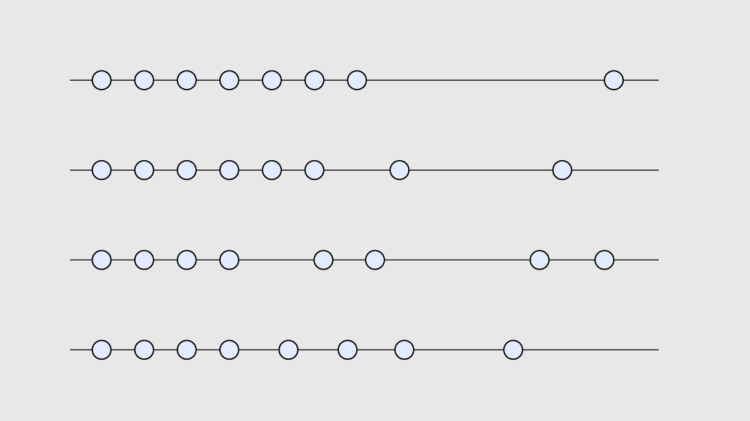
Welcome to The Process, where we look closer at how the charts get made. This is issue #252. I’m Nathan Yau. Visualizing time series data often assumes that your data points are evenly spaced over time, which is not always the case. Here are chart options to show patterns when a time series has uneven gaps.

Become a member for access to this — plus tutorials, courses, and guides.

Exploration of players’ shot improvement in the NBA

Wondering whether if a player’s shot improves over the course of his career, Peter Beshai shows shot performance for all players from the 2018-19 season:

To understand whether or not a player actually gets better over time, we need some kind of baseline to compare their current performance against. On Shotline, the baseline is set after a player completes their first season in the NBA and has shot at least 200 times. This may sometimes feel a bit arbitrary, and I guess it is, but it feels reasonable to compare a player’s first season’s performance to their current to understand whether they have improved or not. The graphs are set up to allow you to compare their current performance against any other point in time too if the baseline is not sufficiently interesting to you.

Tags: ,

[For Members] How to Make (and Animate) a Circular Time Series Plot in R

Also known as a polar plot, it is usually not the better option over a standard line chart, but in select cases the method can be useful to show cyclical patterns. Read More

Prophet for forecasting with a lot of data

Facebook released Prophet, which is a procedure to quickly forecast with time series data.

Prophet is a procedure for forecasting time series data. It is based on an additive model where non-linear trends are fit with yearly and weekly seasonality, plus holidays. It works best with daily periodicity data with at least one year of historical data. Prophet is robust to missing data, shifts in the trend, and large outliers.

Plus it’s available in both Python and R. What. Should be worth a look.

Tags: , ,

Ride on the VR time series roller coaster

VR Nasdaq

Speaking of virtual reality visualization, this Nasdaq roller coaster by Roger Kenny and Ana Asnes Becker for the Wall Street Journal is quite the ride. The underlying data is just the index’s price/earnings ratio over time, but you get to experience the climbs and dips as if you were to ride on top of the time series track.

Weeeeeee, bubble burst.

Tags: , ,

A Crash Course for Visualizing Time Series Data in R

Visualizing Time Series Data in R

Last year I put together a four-week course to provide FlowingData members with guided instruction through a few year’s worth of a la carte visualization tutorials in R. While some people have specific visualization types in mind, you might want to learn more about the overall process.

In the same effort, but a bit more focused, here is a crash course for visualizing time series data in R. It’s meant to be digested over just a couple of days to get you going with your own data right away.

All members can access it now.

If you’re not a member yet, you can sign up here for instant access. I’d love your support.

The crash course is for people relatively new to visualization in R, and you don’t need programming experience to put it to use. You start with the basics, move into more advance visualization, and then work through common stumbling blocks to avoid getting stuck.

Tags: , ,

Spiraling global temperature chart

Global temperature is on the rise, as most of us know. Ed Hawkins charted it in this spiral edition of temperature over time.

See also the Quartz chart that uses a standard coordinate system but stacks lines on top of one another.

Tags: , ,

Members Only: Bivariate Area Charts in R

bivariate-area-featured

Quickly compare two time series variables with this line-area chart hybrid that originated in the 1700s. Read More

Members Only: How to Make Horizon Graphs in R

The relatively new and lesser known time series visualization can be useful if you know what you're looking at, and they take up a lot less space.

Horizon Graphs in R

Continue reading →

Feeling hot, hot, hot

The Hottest Year

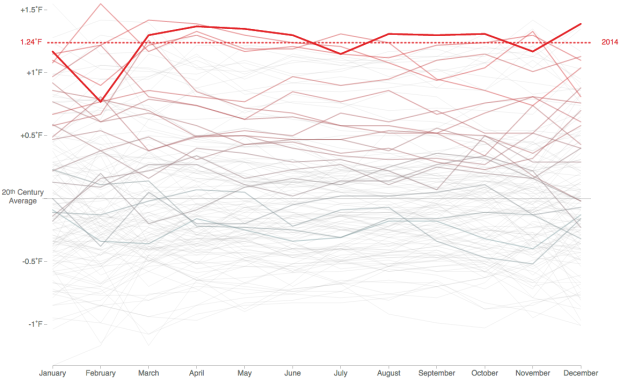
When you look at overall global temperatures over time, you see a rising line and new heat records set. Instead of just one line though, Tom Randall and Blacki Migliozzi for Bloomberg split up the time series by year and animated it.

Each year is overlaid on top of the other with a new time series in each frame. The dotted line rises too as new records are set, and as time passes, the older time series lines fade to the background.

You still get the rising effect as you would with a single time series over the past 135 years, but this view provides more focus to the increase, closer to present time.

Tags: , , , ,