When we watch sports on television, the scale of many sports don’t seem that different, because the camera zooms in on players and everything is within the frame of our screens. So here are the major sports drawn at the same scale to help appreciate the size differences.
Category Archives: sports
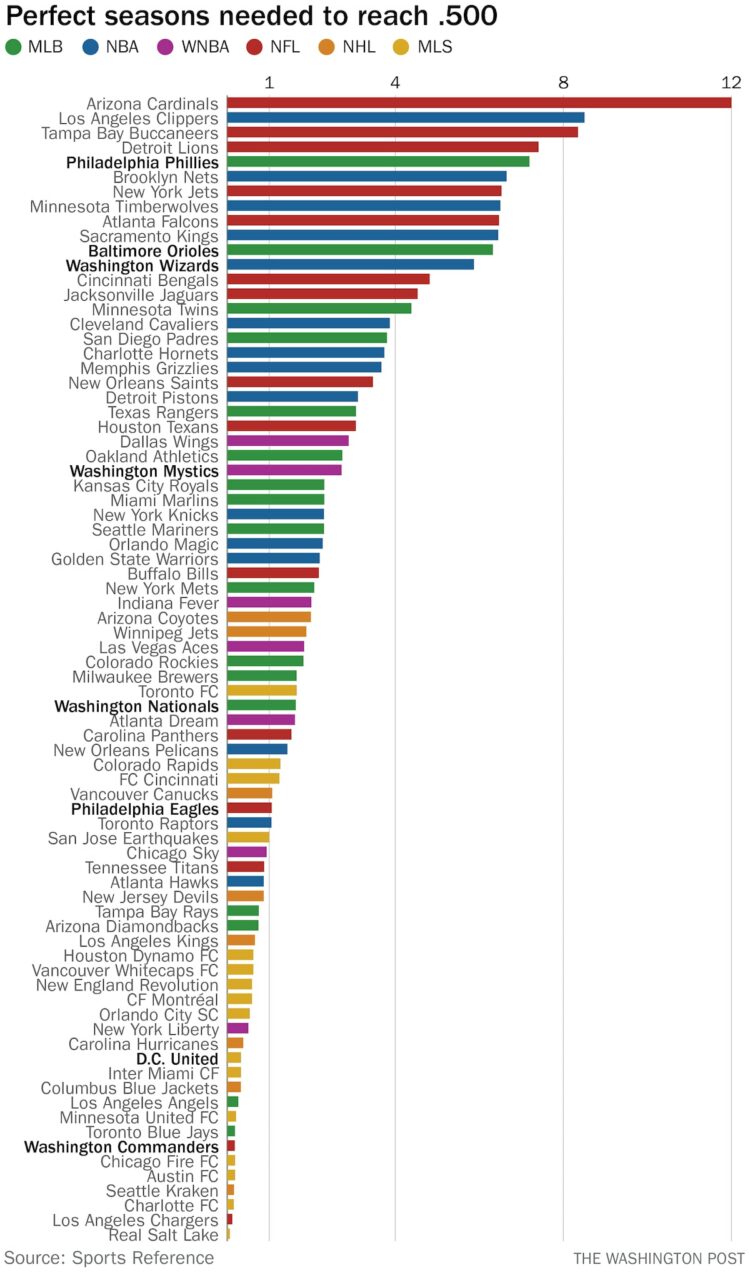
Perfect seasons needed to get over .500 overall
Here’s a fun one from Philip Bump for The Washington Post. Bump simply asks how many wins it would take for sports franchises to reach a .500 record over the life of the franchise. The historically bad teams bubble to the top.
Tags: record, sports, Washington Post, wins
Posted by in record, sports, Statistical Visualization, Washington Post, wins
Chartball is sports data visualized in a playful way
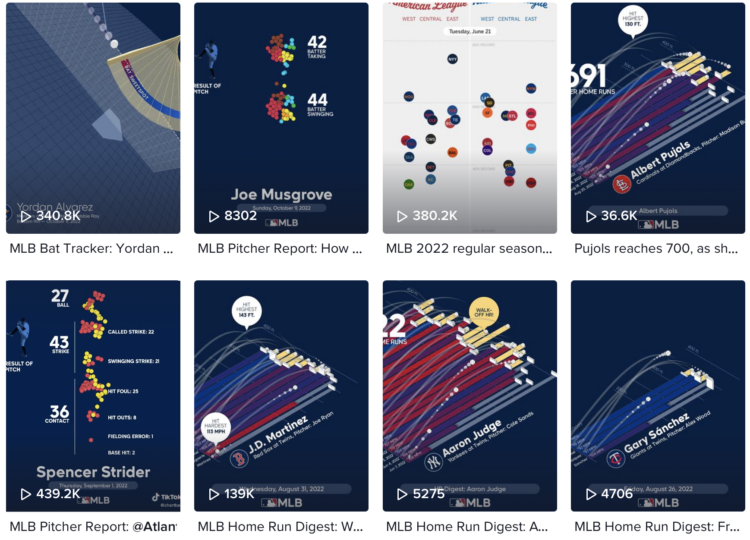
With Chartball, Andrew Garcia Phillips has been visualizing sports data for a while publishing to various mediums — Twitter, Tumblr, posters, and YouTube — showing animated and engaging insights on how individual teams and players perform. It’s clearly a passion project, because no one would make this many charts if they didn’t enjoy it.
TikTok might be the best fitting platform for his short animations focused on a single insight. Here’s an example:
@chartball MLB Pitcher Report: @Atlanta Braves Spencer Strider vs. @Colorado Rockies Sept. 1, 2022 @mlb #baseball #dataviz ♬ It Was A Good Day – Ice Cube
This makes me wonder (1) how other animations and datasets would work in this short video format and (2) if you add music to any animated chart does it instantly make it more fun, because I think it does. [Thanks, Sarah]
Tags: Andrew Garcia Phillips, sports
Posted by in Andrew Garcia Phillips, Infographics, sports
Animated charts to show sports results
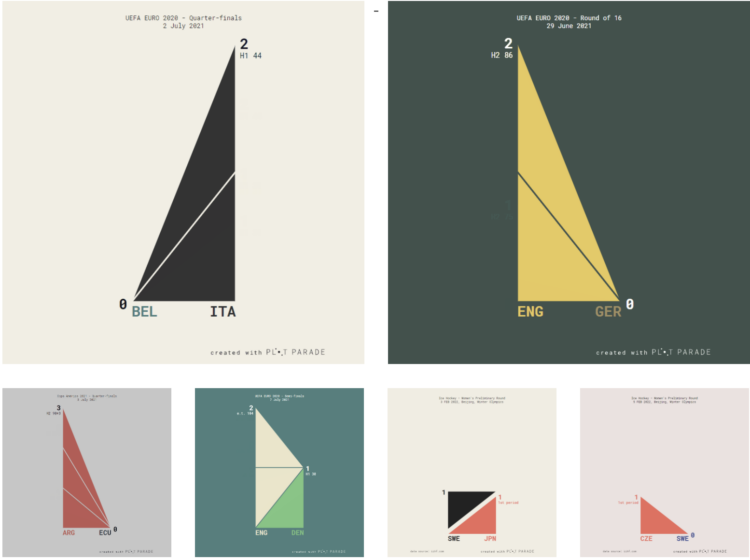
Krisztina Szűcs likes to make animated charts to show sports results, from fencing, handball, soccer, to hockey. She cataloged all of her sports charts in one place. I’m partial to the triangle timelines, which play well to sports with back and forth scores.
Tags: animation, Krisztina Szűcs, sports
Posted by in animation, Infographics, Krisztina Szűcs, sports
R packages useful for sports analytics
If you’re into R and analyzing sports data, you’ll want to save this CRAN task view:
This CRAN Task View contains a list of packages useful for sports analytics. Most of the packages are sport-specific and are grouped as such. However, we also include a General section for packages that provide ancillary functionality relevant to sports analytics (e.g., team-themed color palettes), and a Modeling section for packages useful for statistical modeling. Throughout the task view, and collected in the Related links section at the end, we have included a list of selected books and articles that use some of these packages in substantive ways. Our goal in compiling this list is to help researchers find the tools they need to complete their work in R.
Calculating win probabilities
Zack Capozzi, for USA Lacrosse Magazine, explains how he calculates win probabilities pre-game and during games. On interpretation, which could easily apply to other sports and all forecasts:
But interpretation here matters quite a bit. And this is frustrating for some people, but that 61 percent should be interpreted as: “if these teams played 100 times, we would expect Marquette to win 61 of those games.” It definitely does not mean that the model is 61 percent confident that Marquette will win.
This is a bit odd, but this also means that if the Win Probability model gives Team A a 90% chance to beat Team B, there is nothing wrong with the model if Team B ends up winning the game. The issue would arise if, out of 100 90-percent win probability games, the favorite wasn’t winning around 90 of those games. When the model says 90 percent, you want it to mean 90 percent.
I wonder how many people incorrectly interpret the probability as “61 percent confident”. I bet a lot.
I do know that ever since the Golden State Warriors lost to the Cleveland Cavaliers in the 2016 NBA Finals — while holding a 90-something percent win projection by FiveThirtyEight — I stopped paying attention to win probability. But learning more about the calculation made it more interesting.
Tags: probability, sports, Zack Capozzi
Posted by in probability, sports, statistics, Zack Capozzi
Figure skating animated jumps
Figure skater Nathan Chen set a world record with his performance in the short program. The New York Times has these cute animations to show the completed jumps. Just spinning around four times in the air, no big deal.
Tags: Nathan Chen, New York Times, Olympics, sports
Posted by in Infographics, Nathan Chen, New York Times, Olympics, sports
Exercise researcher earns more retractions as investigations mount
How sports owners pay less taxes than athletes
ProPublica continues their analysis of an anonymous dump of tax records, this time with a focus on billionaire sports owners:
The law favors people who are rich because they own things over people who are rich because they make a high income from their work. Wages — the main source of income for most people, including athletes — are taxed at the highest rates of all, topping out at a marginal rate of 37% plus an extra 3.8% for Medicare. The government takes a smaller share of money made from, say, selling a stock. That’s not to mention the benefits available to people who own businesses, such as the paper losses created by buying a sports team.
Easy solution: We’ll all just buy a sports team.
Tags: billionaires, ProPublica, sports, taxes
Posted by in billionaires, ProPublica, sports, Statistical Visualization, taxes


