
This is necessarily uncomfortable to go through, but for The Washington Post, N. Kirkpatrick, Atthar Mirza, and Manuel Canales show the bodily damage caused by an AR-15 bullet versus a 9mm round.
Tags: damage, guns, shootings, Washington Post
Adam's Blogroll: click through to the author's blog
This is necessarily uncomfortable to go through, but for The Washington Post, N. Kirkpatrick, Atthar Mirza, and Manuel Canales show the bodily damage caused by an AR-15 bullet versus a 9mm round.
Tags: damage, guns, shootings, Washington Post
Posted by in damage, guns, Infographics, shootings, Washington Post
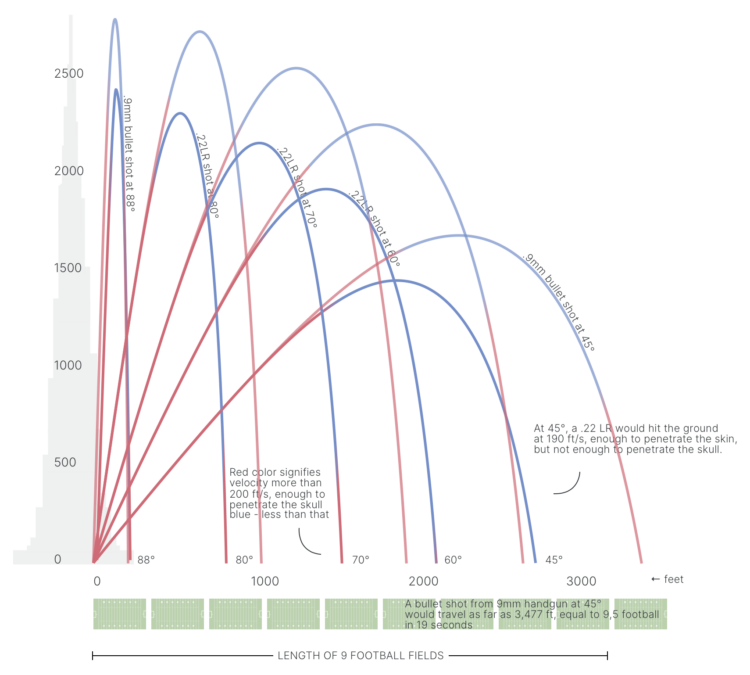
When someone fires a gun into the air, the bullet travels thousands of feet in elevation. Gravity pulls the bullet back down, and it accelerates fast enough to penetrate a human skull by the time it reaches ground-level. Acceleration and trajectory vary by type of gun and the shot angle. 1Point21 Interactive shows the variation and dangers with a visual explainer.
Tags: 1Point21, guns, trajectory
Posted by in 1Point21, guns, Infographics, trajectory
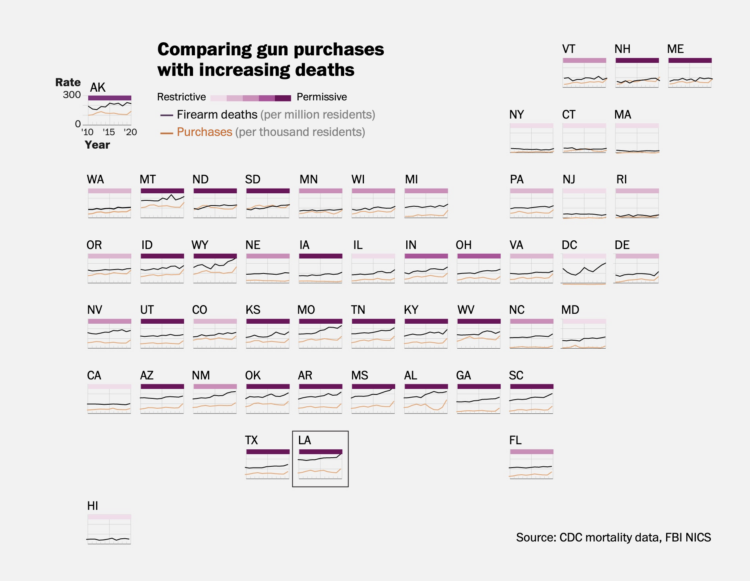
As I’m sure you know, mass shootings, which gain attention because the scale of their severity is so high, make up only a fraction of total gun deaths. Several tens of thousands of people die from gun shots every year in the U.S. The Washington Post describes the full scope, covering purchases, restrictions, race, and geography.
Tags: guns, law, mortality, Washington Post
Posted by in guns, law, mortality, Statistical Visualization, Washington Post
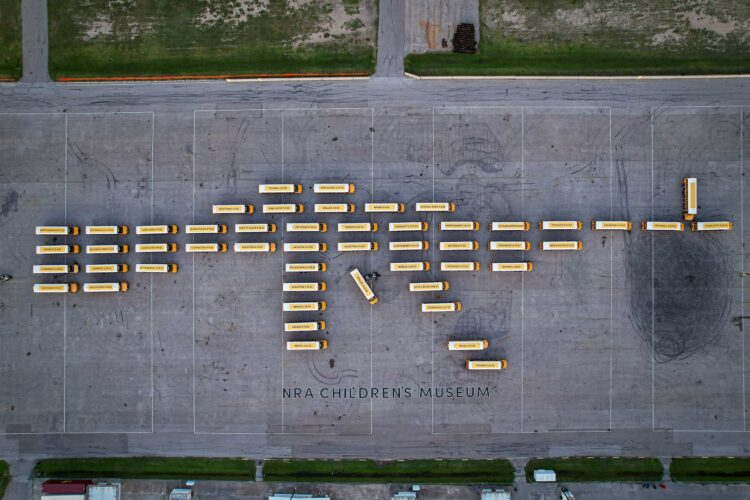
The NRA Children’s Museum from Change the Ref is a mile-long convoy of empty school buses in memory of lives lost to guns:
Since 2020, firearms have overtaken car accidents to become the leading cause of death in children, taking over 4368 lives.
With the advent of this horrific moment, we’ve built a mobile museum made of 52 empty school buses representing 4368 victims. Some of the buses feature an exhibit of artifacts, photos, videos, audio recordings, and personal memories of these children who have lost their lives to guns.
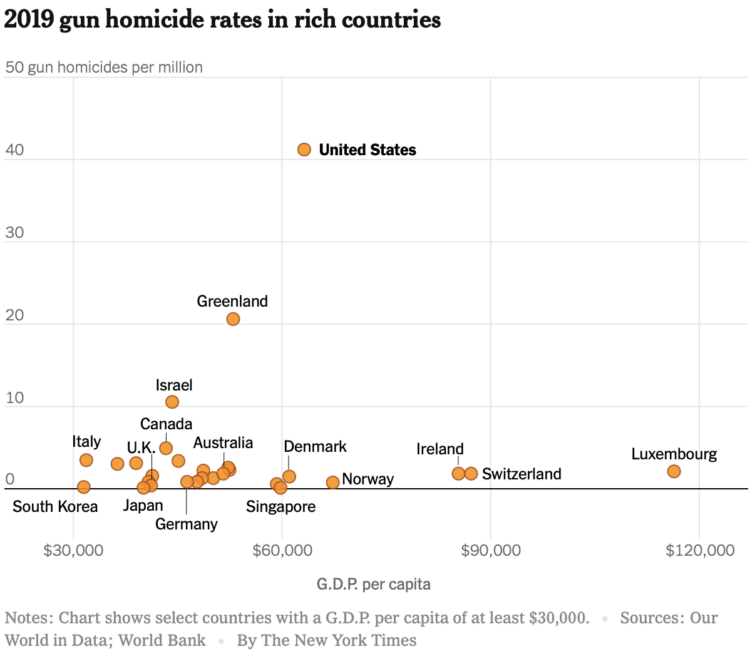
This chart from The New York Times, based on estimates from Our World In Data and World Bank, shows GDP per capita against gun homicide rates. The United States stands alone. Why.
Posted by in guns, homicide, Statistical Visualization

FiveThirtyEight and The Trace investigate the uncertainty and accuracy of gun injury data released by the Centers for Disease Control and Prevention:
An analysis performed by FiveThirtyEight and The Trace, a nonprofit news organization covering gun violence in America, found that the CDC’s report of a steady increase in nonfatal gun injuries is out of step with a downward trend we found using data from multiple independent public health and criminal justice databases. That casts doubt on the CDC’s figures and the narrative suggested by the way those numbers have changed over time.
It might be time to update the statistical models used to estimate injuries.
Tags: FiveThirtyEight, guns, The Trace, uncertainity
Posted by in FiveThirtyEight, guns, statistics, The Trace, uncertainity
 |
| The 2nd Amendment of the U.S. Constitution, the Bill of Rights: "A well regulated Militia, being necessary to the security of a free State, the right of the people to keep and bear Arms, shall not be infringed." |
 |
| Figure 1 A neighbour-net visualizing the differences in gun legislation in the U.S.A. Blue stars indicate states where guns have to be registered. |
 |
| Figure 2 Same graph as in Fig. 1, showing the original Thirteen Colonies (1700s) and the states of the Confederacy (1800s). |
Posted by in EDA, guns, neighbour-net

Jane Solomon collected tweets that used the gun emoji, and looked at what emojis were used before and after as a way to see how people used the gun.
It seems that the sarcastic and reflexive gun emoji pairings are extremely popular, which matches my expectations and the knowledge I brought into this exercise. One result that surprised me was the high collocation with the gun and various heart emoji. I had never personally associated the gun emoji as a means to express heartbreak, but it’s there in the data.
[via Waxy]
Posted by in emoji, guns, statistics

With this scatterplot, Quoctrung Bui and Margo Sanger-Katz for The Upshot describe where experts and the public agree and disagree on gun control. Basically, whether it’s the best or not, the top right is what policymakers are looking for. Make sure to check out the breakdowns for various groups of people.
Posted by in guns, Infographics, Upshot

Sometimes data can look really noisy when you zoom in close, and so you zoom out to get a better look at an overall trend. Sometimes it goes the other way. The Guardian looks at gun violence data at the local, census tract level, to focus on not just cities, but the clusters within the cities.
America’s gun policy debate is usually driven by high-profile mass shootings that seem to strike at random, and it focuses on sweeping federal gun control or mental health policies. But much of America’s gun homicide problem happens in a relatively small number of predictable places, often driven by predictable groups of high-risk people, and its burden is anything but random.
I like the scroll action that first shows the map with randomly distributed dots and then transitions to reality. Drives the point home.