What works in visualization, scientifically speaking

Steven L. Franconeri, Lace M. Padilla, Priti Shah, Jeffrey M. Zacks, and Jessica Hullman published in Psychological Science in the Public Interest an expansive review of what researchers know so far about how visualization works:

Effectively designed data visualizations allow viewers to use their powerful visual systems to understand patterns in data across science, education, health, and public policy. But ineffectively designed visualizations can cause confusion, misunderstanding, or even distrust—especially among viewers with low graphical literacy. We review research-backed guidelines for creating effective and intuitive visualizations oriented toward communicating data to students, coworkers, and the general public. We describe how the visual system can quickly extract broad statistics from a display, whereas poorly designed displays can lead to misperceptions and illusions. Extracting global statistics is fast, but comparing between subsets of values is slow. Effective graphics avoid taxing working memory, guide attention, and respect familiar conventions. Data visualizations can play a critical role in teaching and communication, provided that designers tailor those visualizations to their audience.

The paper is free to access.

I’m bookmarking this for later. It’s going to take a while to digest.

Tags: ,

Colour Controversy is a game of perception and labeling

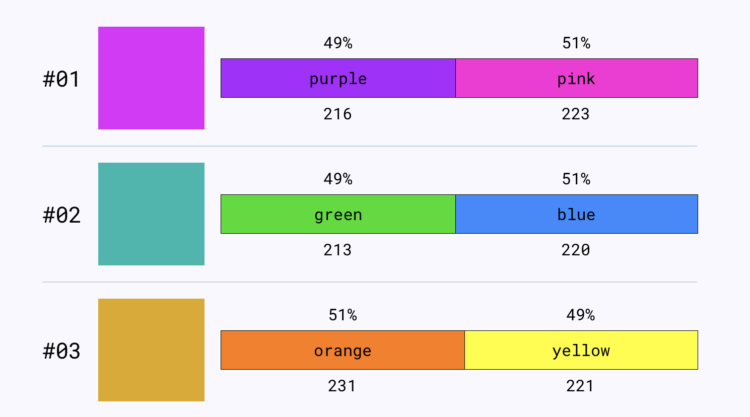
Colour Controversy is a simple game that shows you a shade and asks you what color it is. The fun part is that the shades are usually in between two colors, say blue and green, and you can only choose one. A running tally is kept so that you can see the “most controversial” colors.

Tags: , ,

Game of Distraction

They say a watched pot never boils. So here's a game where you try to make the pot boiling by looking somewhere else. Read More

Optical illusion shows our messed up lightness perception

A gray piece of paper moves along a gradient. You won’t believe your eyes.

Tags: ,

Visualization color picker, based on perception research

The colors you choose to visualize data can completely shift what you convey to a reader. With an ominous color palette, a graphic meant to be light and fun comes off the wrong way. Or the other way around. You wouldn’t use Comic Sans for your résumé (right…?), so choose colors that fit the topic. Viz Palette, made by Elijah Meeks and Susie Lu, aims to make the choosing part easier.

It’s still up to you to figure out the right overall scheme, but Viz Palette takes care of the stuff in between, such as designing for color blindness and perceptually evenly-spaced shades. It also includes a “color report” that points out shades that might look the same in various situations.

While there are many color-picking tools (I typically stick to four.), they are often too simple, overly-complicated, or research-centric. This one seems to strike a good balance for practicality.

Tags: ,

Use dual axes with care, if at all

Dual axes, where there are two value scales in a single chart, are almost never a good idea. As a reader, you should always question the source when you see a chart that uses such scales. Zan Armstrong explains with a recent example.

One of the best descriptions I’ve heard for data viz is that: when the data is different, the viz should look different and when the data is similar, the viz should look similar.

If you allow yourself to have two y-axis for the same metric, with both a different scale on each axis and a different base value, then you can make a lot of charts with the exact same data that look very different.

If there’s a direct transformation between the scales, say between metric and Imperial units, then okay, that’s fine. In almost all other cases, people use dual axes to overemphasize a relationship between two variables, and you should wonder why the maker did that.

Tags: ,

Square pie chart beats out the rest in perception study

Square pie charts vs regular pies

Many hate pie charts. Others love them. I think they’re useful but have limitations. Most of these are just feelings though, maybe accompanied by an Edward Tufte quote. We need facts. Robert Kosara and Drew Skau provide some in their recent studies on how we read pie charts. There appears to be a good chance people don’t read the things correctly.

But I found Kosara’s follow-up more interesting. He dug up a paper that he and his student Caroline Ziemkiewicz wrote a few years ago on square pie charts. Instead of filling a circle to represent proportion, the square pie chart fills a — wait for it — square.

In terms of reading the actual represented proportion, the square one performed best, against the stacked bar, pie, and donut.

More surprising (to me at least) was that the stacked bar, which represented only two values in the study, performed worst. I know that stacked bars with several values can be tricky, but just two? That’s essentially a progress bar to show that a page is loading. People everywhere are misjudging the time left to load sites in their browsers everywhere. Gasp.

More details.

Tags: ,

Human perception for visualization

Human perception

There is visualization in practice and there is visualization in theory and research. Each should inform the other, but it typically doesn’t happen that way. Kennedy Elliot, a graphics editor at the Washington Post, provides a rundown of one branch from the research side of things: human perception. There are quite a few studies.

Tags:

Science for the People: Eye of the Beholder

sftpThis week, we’re learning about the history of optics, and how our perception of the world and how we see it underwent a radical transformation in 17th-century Holland. We’ll spend the hour with historian, philosopher, and science writer Laura J. Snyder, talking about her book Eye of the Beholder: Johannes Vermeer, Antoni Van Leeuwenhoek and the Reinvention of Seeing.

Science for the People is now on Patreon, and is accepting your support and donations! Visit the Patreon page to get more information about how it works, and learn about the extra content you can access as a monthly supporter! You can also find out what other ways you can support the show, or visit our bookshelf.

*Josh provides research help to Science for the People and is, therefore, completely biased.


Filed under: Curiosities of Nature Tagged: Antoni Van Leeuwenhoek, Eye of the Beholder, Johannes Vermeer, Laura J Snyder, laura snyder, optics, patreon, perception, Podcast, science for the people

Three retractions for Oregon neuroscience student investigated by ORI

Journals have retracted three out of the four papers flagged by the Office of Research Integrity during its investigation of a University of Oregon neuroscience student, David Anderson. Last month, when we first reported on the case, Anderson told us that he “made an error in judgment,” and took “full responsibility.” Two of the retraction notes say that Anderson […]

The post Three retractions for Oregon neuroscience student investigated by ORI appeared first on Retraction Watch.