Carbon footprint in the city versus the suburbs

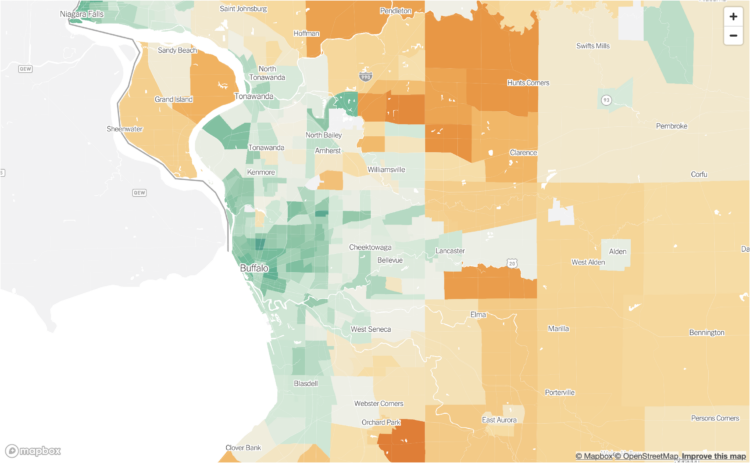
Bringing it down the Census tract level, Nadja Popovich, Mira Rojanasakul and Brad Plumer, for The New York Times, mapped emission estimates so you can see the impact of your neighborhood:

A map of emissions linked to the way people consume goods and services offers a different way to view what’s driving global warming. Usually, greenhouse gases are measured at the source: power plants burning natural gas or coal, cows belching methane or cars and trucks burning gasoline. But a consumption-based analysis assigns those emissions to the households that are ultimately responsible for them: the people who use electricity, drive cars, eat food and buy goods.

The estimates are based on research from the University of California, Berkeley.

We often think of big cities as dirtier and more pollution-heavy. By absolute counts, because there are more people, this is a correct statement, but from a per household point of view, the contrast is flipped.

Tags: , ,

Maps of wildfire smoke pollution

Wildfire obviously damages the areas it comes in direct contact with, but wildfire smoke can stretch much farther. Based on research by Childs et al., Mira Rojanasakul, for The New York Times, shows how pollution from smoke spread between 2006 and 2020.

My kids’ rooms still have air filters from a few years ago, when a fire many miles away made the sky orange and our indoor environment smokey.

Tags: , , ,

Maps of noise

Karim Douïeb, in collaboration with Possible, mapped noise in Paris, New York, and London. The color on each map represents noise level, and if you have your sound on, you can mouse over areas to hear what noise might be like. The project, Noisy Cities, is an adaptation of Douïeb’s previous map of Brussels.

You get a good idea of what noise pollution is like geographically. All it needs now is a machine to blow varying levels of smog in your face.

Also something new I learned: the Department of Transportation has a transportation noise map that shows modeled noise levels nationally.

Tags: , ,

Animated map of microplastics in the ocean

Using estimates based on satellite data, Joshua Stevens for NASA Earth Observatory mapped the concentration of microplastics in the ocean over time:

Researchers at the University of Michigan (UM) recently developed a new method to map the concentration of ocean microplastics around the world. The researchers used data from eight microsatellites that are part of the Cyclone Global Navigation Satellite System (CYGNSS) mission. Radio signals from GPS satellites reflect off the ocean surface, and CYGNSS satellites detect those reflections. Scientists then analyze the signals to measure the roughness of the ocean surface. These measurements provide scientists with a means to derive ocean wind speeds, which is useful for studying phenomena like hurricanes. It turns out that the signals also reveal the presence of plastic.

Tags: , ,

Where cancer risk is greater due to air pollution

Based on five years of data from EPA models, ProPublica mapped areas in the United States where cancer risk is higher due to air pollution:

In all, ProPublica identified more than a thousand hot spots of cancer-causing air. They are not equally distributed across the country. A quarter of the 20 hot spots with the highest levels of excess risk are in Texas, and almost all of them are in Southern states known for having weaker environmental regulations. Census tracts where the majority of residents are people of color experience about 40% more cancer-causing industrial air pollution on average than tracts where the residents are mostly white. In predominantly Black census tracts, the estimated cancer risk from toxic air pollution is more than double that of majority-white tracts.

Interact with the full map here.

Tags: , ,

Pollution exposure plotted, a comparison between two kids’ day

The New York Times measured pollution exposure during the day for two kids who live in New Delhi. Usually just described in terms of micrograms of particulate matter, the piece puts in more effort to give a feel for each person’s day-to-day. Side-by-side video along with a scrolling line chart provide a clear contrast between the two lives.

Tags: , ,

Making invisible gas leaks visible

For The New York Times, Jonah M. Kessel and Hiroko Tabuchi went to oilfields in Texas with an infrared camera to look for methane leaks.

Okay, important topic here, and the contrast between regular photograph and infrared video is alarming, but I may have been drawn to the methodology at the end:

To create images of methane emissions in the Permian Basin, The Times used a custom-built FLIR camera that converts infrared energy into an electronic signal to create moving pictures. The camera’s filter allows infrared wavelengths between 3.2 to 3.4 micrometers on the electromagnetic spectrum to pass through to the sensor.

To visualize gas, the camera uses helium to cool down the sensor to the temperature of liquid nitrogen, around minus 200 degrees Celsius. Unlike traditional photography lenses, which are glass, the infrared images were created using metal lenses made from germanium, which is transparent at infrared wavelengths.

Tags: , ,

Compare your city’s air pollution to the rest of the world

High air pollution can lead to serious health risks, but you can’t usually see particulate matter floating in the air around you. So we have no base for comparison and only an abstract sense of what’s bad and okay. The New York Times tries to make the pollution more visible.

They lead with moving particles across your screen at a density that matches approximately to what the Environmental Protection Agency defines as “good” air quality. Then the number of particles increases to peak air pollution in your area this year. Then the density increases again for the really bad areas around the world.

So you get a baseline, a relatable point with geography, and then a point of perspective.

Be sure to check out the piece on your phone (only on updated iPhones?) to get the augmented reality view. Whoa.

Tags: , ,

Mapping chemical plants, the pollution around them, and more chemical plants

ProPublica, with The Advocate and The Times-Picayune, estimated chemical concentrations in a highly polluted area along the Mississippi River that will probably get worse soon:

The industrial stretch of the Mississippi River between Baton Rouge and New Orleans, a region known as “Cancer Alley,” is one of the most highly polluted areas in the country. A ProPublica analysis using a scientific model developed by the Environmental Protection Agency shows that some of the neighborhoods where new plants are being built already have very high concentrations of toxic chemicals. But Louisiana continues to approve the building of these new plants and the expansion of existing ones.

Yikes.

Tags: , ,

Years of life lost due to breathing bad air

Researchers at the University of Chicago’s Energy Policy Institute estimated the number of years lost and the number of people affected due to particulate matter in the air. They estimated per country. The Washington Post used a mosaic plot, aka a Marimekko chart, to show the differences.

The width of each column represents total population for a country. The sections in each columns represent the number of people who will lose a certain number of years. Color represents average years of life lost.

These charts are often a bit confusing at first glance, but the scrolling format used here provides some guidance.

Tags: , , ,