✚ Explaining More, Assuming Less

Welcome to The Process, where we look closer at how the charts get made. I’m Nathan Yau, and I’m figuring out what to assume from readers, even if they are smart and well-informed.

Become a member for access to this — plus tutorials, courses, and guides.

Educational statistics illustrations

Allison Horst often illustrates data science concepts and tools with anthropomorphized shapes and animals. She recently cataloged her illustrations, which are open source and entertaining if you are a nerd.

Tags: , , ,

Catching students cheating with R

Matthew Crump, a psychology professor who discovered high volume cheating in his class via WhatsApp, outlines the saga in five parts. Bonus points for use of R to analyze the evidence:

I do a lot of teaching on using computational tools for reproducible data analysis. I can input some data and run it through a script for analysis. When the data changes I can run it through the same script and get the new analysis. The chat archive had changed and this time it was easier to do the analysis all over again. I redid all the counts of academic integrity violations and rewrote the forms spelling out sanctions for each student. So many forms, I died a little inside once for every form.

Tags: , , ,

Announcing the Oxford Statistical Genomics Summer School 2022

Join us at St Hilda's College Oxford, overlooking the River Cherwell and Christ Church Meadow, for an immersive week-long residential post-graduate summer school on Statistical Genomics on 19th-24th June 2022. This course aims to connect post-graduate and post-doctoral researchers from academia and industry with experts at Oxford's Big Data Institute, Wellcome Centre for Human Genetics, and Department of Statistics.

Our friendly tutors, internationally recognised for their scientific expertise, will offer specialist instruction and hands-on computer practicals across five broad areas of Statistical Genomics: Next-generation Sequence Data Analysis, Gene and Variant Association Testing, Genomics of Infectious Diseases, Genealogical Inference and Analysis, and Medical Genomics.

The course is aimed at trainee scientists actively engaged in statistical genomics research, who wish to expand their knowledge of concepts and techniques.

Click here for more information including how to apply.


✚ The Process 105 – Piecing Together the Basics

You gotta walk before you crawl. Wait a minute. Read More

Teaching: Online lectures and practical on Phylogenetics in Practice

On March 16th, we were in the interesting position of running an infectious disease course at the Big Data Institute on the day the national lockdown was announced in response to the COVID-19 pandemic. As a result, we were among the first in the university to do remote teaching, something Katrina Lythgoe and the rest of us had prepared for in anticipation of the lockdown a week earlier that never happened.

These are the two online lectures in the Health Data Sciences CDT that I gave called Phylogenetics in Practice.


The online practical, which applies phylogenetics approaches to understand the Zika virus epidemic, is implemented as a Docker container, and available here.

Understanding Covid-19 statistics

For ProPublica, Caroline Chen, with graphics by Ash Ngu, provides a guide on how to understand Covid-19 statistics. The guide offers advice on interpreting daily changes, spotting patterns over longer time frames, and finding trusted sources.

Most importantly:

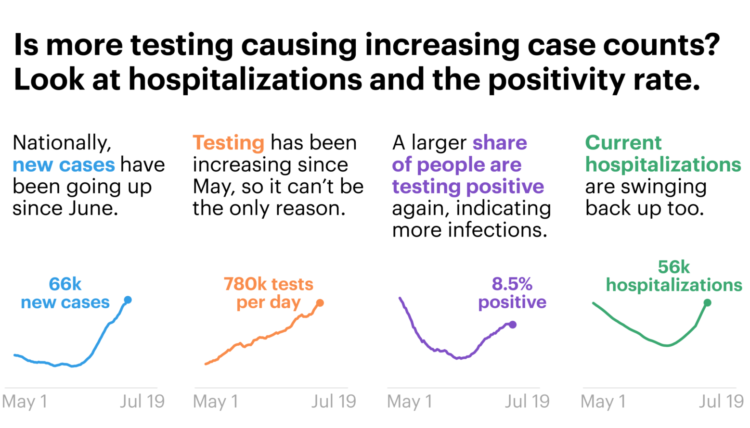
Even if the data is imperfect, when you zoom out enough, you can see the following trends pretty clearly. Since the middle of June, daily cases and hospitalizations have been rising in tandem. Since the beginning of July, daily deaths have also stopped falling (remember, they lag cases) and reversed course.

I fear that our eyes have glazed over with so many numbers being thrown around, that we’ve forgotten this: Every day, hundreds of Americans are dying from COVID-19. Some days, the number of recorded deaths has reached more than 1,000. Yes, the number recorded every day is not absolutely precise — that’s impossible — but the order of magnitude can’t be lost on us. It’s hundreds a day.

Cherrypicking statistics is at an all-time high. Don’t fall for it.

Tags: , , ,

Teaching kids data visualization

Jonathan Schwabish gave his fourth-grade son’s class a lesson on data visualization. He wrote about his experience:

I’d love to see a way to make data visualization education a broader part of the curriculum, both on its own and linked with their math and other classes. Imagine adding different shapes to maps in their Social Studies classes to encode data or using waterfall charts in their math classes to visually demonstrate a simple mathematical equation or developing simple network diagrams in science class. The combination of the scientific approach to data visualization and the creativity it sparks could serve as a great way to help students learn.

Maybe I should introduce Schwabish’s Match It Game to the Yau household. My five-year-old has been asking why I keep “doing data.”

Tags: ,

Teaching is another way of learning: The rewards of being a teaching assistant

   Jiao xue xiang zhang. (“Teaching benefits both teachers as well as students” in Chinese). ——Thirteen Classics Explanatory Notes and Commentaries ( shi san jing zhu shu in Chinese)   Each of us has a

Datasets for teaching data science

Rafael Irizarry introduces the dslabs package for real-life datasets to teach data science:

[I] try to avoid using widely used toy examples, such as the mtcars dataset, when I teach data science. However, my experience has been that finding examples that are both realistic, interesting, and appropriate for beginners is not easy. After a few years of teaching I have collected a few datasets that I think fit this criteria. To facilitate their use in introductory classes, I include them in the dslabs package.

Tags: ,