Category Archives: collaboration
PLOS and the University of California announce open access publishing agreement
Posted by in collaboration, featured, In the News, open access, open science, Publishing, science publishing
Spreading the Word: PLOS Advances Research Through Media Partnerships
 Last year, PLOS helped more than 2,300 articles receive media coverage in high-profile outlets including The New York Times, the BBC, National Geographic, Scientific American and The Washington Post. How do we do it? For
 Posted by in collaboration, featured, impact, In the News, media, open access, open science, Publishing, science communication
Science Twitter and the Secretly Super-rare Saxifragaceae
 Top Image: a figure from “The hidden Heuchera: How science Twitter uncovered a globally imperiled species in Pennsylvania, USA” During one of the coolest experiences of my PhD, I had the opportunity to work
Posted by in botany, collaboration, crowdsourcing, featured, flora, iNaturalist, new research, Public science communication, Social Media, twitter, youtube
How do you count all those trees, anyway?
 0000-0002-8715-2896 Like many scientists, Jean-François Bastin and colleagues had a question. A question that on its surface seems like it may have an obvious answer, or at least, an obvious way to find out the
DEB Numbers: FY 2016 Wrap-Up
Fiscal year 2016 officially closed out on September 30. Now that we are past our panels in October and early November, we have a chance to look back and report on the DEB Core Program merit review and funding outcomes for FY 2016.
This post follows the format we’ve used in previous years. For a refresher, and lengthier discussions of the hows and whys of the metrics, you can visit the 2015, 2014, and 2013 numbers.
Read on to see how 2016 compares.
FY2016 Summary Numbers
The charts below all reflect proportions of DEB Core Program projects through each stage of the review process: preliminary proposals, full proposals, and awards.
In the review process leading to awards in FY2016:
DEB reviewed 1502 preliminary proposals received under the DEB Core Programs solicitation and LTREB solicitation in January 2015, about 26% of which were invited to the full proposal stage.
The preliminary proposal invitees were joined at the full proposal stage by 1) Direct submissions to DEB under the CAREER, OPUS, and RCN solicitations, and 2) Projects shared for co-review by another NSF program. Altogether 524 full proposals were reviewed in DEB during October and November of 2015.
From this pool of full proposals, DEB made awards to 133 projects (technically, these were 202 separate institutional awards but for analysis purposes we count collaborative groups once, i.e., as a single proposed project).
Below, we present and discuss the Division-wide success rate and some selected project demographics that were concerns coming in to the preliminary proposal system. The demographic numbers are presented as proportions for comparison across the review stages. However, the progressive reduction in size of the denominators from preliminary proposals (1502) to awards (133) means each step becomes more sensitive to small absolute changes.
Success Rate
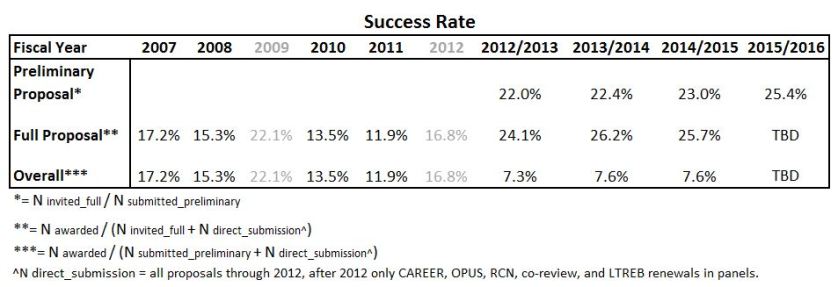
Success rate is a function of the number and size of requests submitted by the research communities and appropriated funding levels. The success rate for research proposals in the DEB Core Programs (Figure 1) has stabilized (even rebounded somewhat) since the preliminary proposal process was instituted. This stabilization emerges from:
- Stable award numbers: Since FY 2013 the number of Core Program awards has consistently been between 131 and 136 funded projects[i].
- Reduced request numbers: The initial wave of new people “testing the waters” by submitting a preliminary proposal is subsiding. As PIs became more familiar with the process, total submissions have dropped by about 10% across the last three years. With stable award numbers, fewer submissions translate directly into a 10% increase in overall success rate from 7.3% in FY2013 to 8.1% for 2016.

Figure 1: DEB Core Program success rates from fiscal year 2007 through the present. Prior to fiscal year 2012, there were two rounds of full proposal competition per fiscal year. Preliminary proposals were first submitted in January 2012, initiating the 2-stage review process and leading to the fiscal year 2013 award cohort.
Calculation Notes:
Preliminary proposal success rate is calculated as the number of invitations made divided by the number of preliminary proposals submitted.
Full proposal success rate is calculated as the number of awards made, divided by the number of full proposals reviewed.
Note that post-2012, under the preliminary proposal system, the set of full proposals reviewed is ~80% invited full proposals and ~20% CAREER, OPUS, RCN and co-reviewed proposals, the latter of which are exempt from the preliminary proposal stage.
Overall success rate is calculated as the number of awards made divided by the total number of distinct funding requests (i.e., the sum of preliminary proposals submitted plus the exempt CAREER, OPUS, RCN, and co-reviewed full proposals).
Reminder: Elevated success rates (in 2009 and 2012) were due to:
- a one-time ~50% increase in funding for FY2009 (the ARRA economic stimulus funding) without which success would have been ~13-15%; and,
- a halving of proposal submissions in FY2012 (the first preliminary proposal deadline replaced a second full proposal deadline for FY2012), without which success would have been ~8-9%.
Individual and Collaborative Projects
As seen in Figure 2 below, there was little year-to-year change in the submission and funding success of single investigator projects. While the proportion of single investigator preliminary proposals increased slightly, there was a small decrease in both the full proposal and award groups. As a reminder to readers: the gap between the proportion of single investigator projects in the preliminary proposal and full proposal stages is due to the single-investigator proposals in the CAREER and OPUS categories. The CAREER and OPUS proposals are not subject to the preliminary proposal screen and make up a relatively larger portion of the full proposals. Similarly, the absence of CAREER and OPUS proposals at the preliminary proposal stage lowers the single investigator proportion of the preliminary proposal counts relative to the historical full proposal baseline.
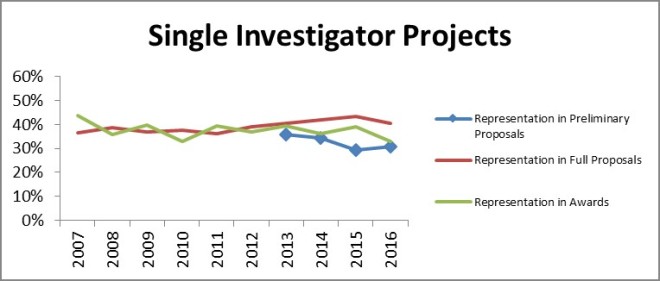
Figure 2: The proportion of DEB Core Program projects lead by a single PI over time and at the different stages of merit review.
The proportion of collaborative proposals in our award portfolio rebounded from last year’s drop and is near the all-time high for both full proposals and awards. This is consistent with the general trend toward greater collaboration over the past decade and beyond.

Figure 3: The proportion of DEB Core Program projects with two or more different institutional participants over time and at the different stages of merit review.
Readers may notice that the collaborative and single-investigator groupings don’t sum to 100%. The remainders are intra-institutional multi-PI arrangements; such projects are certainly intellectual collaborations, but they are not a “collaborative project” per the NSF PAPPG definition (Figure 3).
Early Career Scientists
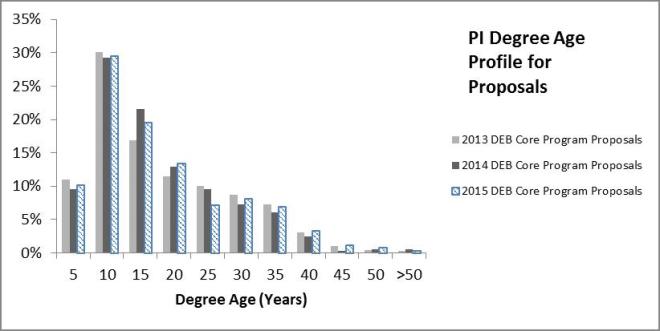
The best identifier of researcher career stage is a metric we calculate. It is the difference between the year that the PI obtained their Ph.D. (a self-reported by the PI) and the current date. This number can be used as a proxy for how long each individual has been in the population of potential PIs.
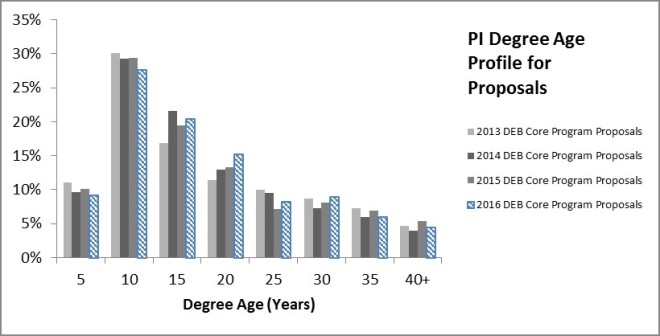
Figure 4: Distribution of degree ages among PIs on DEB Core Program full proposal submissions.

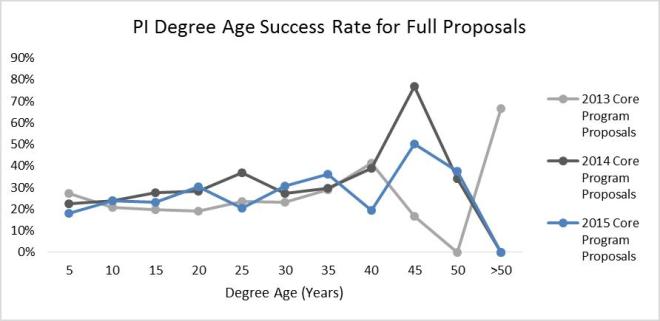
Figure 5: Full proposal success rates for PIs on DEB Core Program proposals by degree age. Figure displays annual data and a 4-year mean for the period of the preliminary proposal system in DEB.
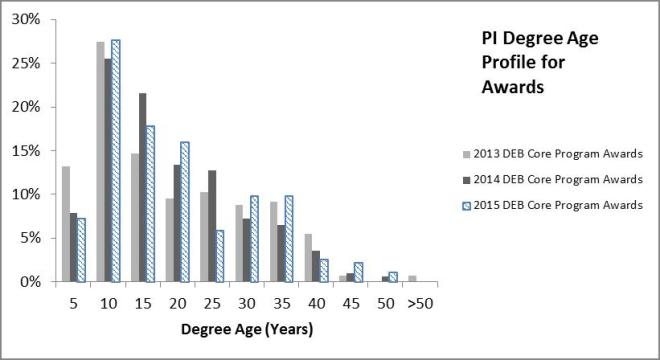
Little changes in the profile of submitter- and awardee-degree ages from 2013 through 2016. Moreover, success rate improves slightly with degree age. Success rates climb slowly from 20% for the newest PhDs, to 30% at 35 years post PhD. Note: PIs more than 35 years post-PhD comprise ~5% or less of the total PIs on proposals and awards. Although more experienced PIs have a somewhat better individual success rate, the PI population skews toward the early career group. Thus, early-, mid-, and later-career PIs wind up with similar representation in core program award decisions.
Gender & Predominantly Undergraduate Institution (PUI) Status
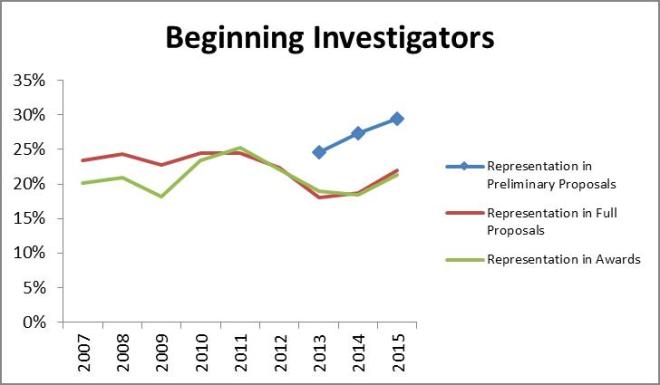
Another concern heading in to the preliminary proposal system was that there would be unintended consequences for different categories of submitters. Two years ago we saw a small change in award numbers lead to a visually jarring drop in the representation of female PIs among DEB awards, as well as a jump in the proportion of PUI awardees. Last year, we saw the pattern reversed. In addition to the apparent negative correlation between the proportion of female PI awardees and PUI awardees that has appeared, the award data just appears noisier than it was under the old system. But, as we stated in last year’s 2015 Wrap-up post:
We conclude that we are witnessing a small numbers effect; 131 awards is simply not a sufficiently large “sample” to be representative of the population across all of the potential decision-making variables and concerns. PUIs are a minority component of the proposal pool (~18%). Female PIs are a minority component of the proposal pool (~30%). Beginning Investigators are a minority component of the proposal pool (~20%). Proposals that fall into two categories are an even smaller fraction of the proposal pool (~6%) and proposals that fit into all three are even smaller yet (~1%).”
Which now brings us to 2016.
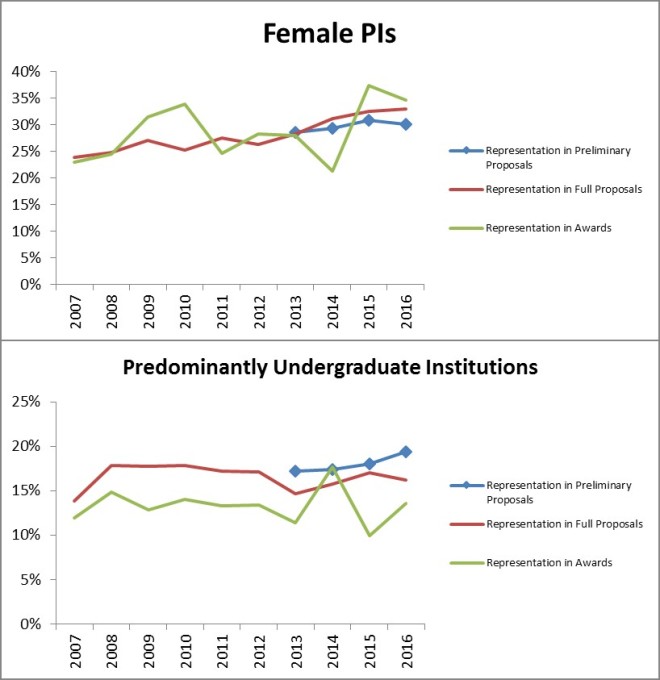
Figure 6: The representation of female PIs and predominantly undergraduate institutions in DEB Core Program proposals and awards. These two groups were noted by the community as groups of concern that would be potentially impacted by the pre-proposal system.
Once again, we see the same pattern in the representation of female PIs and PUIs in the award portfolio: one goes up, the other down. As best as we can determine, our previous conclusion still provides the best explanation: with only 133 projects awarded, it’s a small numbers problem.
The longer-term pattern for both groups is not affected by these latest numbers. The proportion of female PIs has been increasing between by 0.5-1 percentage points per year. The proportion of primarily undergraduate institutions has held steady and there’s a ~4 percentage point gap from the full proposal to the award stage. The PUI gap pre-dates the preliminary proposal system and this group was not intended to be impacted by the preliminary proposal process, so we didn’t expect change.
Moreover, we note that the proportion of PUI preliminary proposals is growing. This represents a small absolute increase but is exaggerated by the reduced total number of preliminary proposals. While there has been no corresponding change in full proposals and awards, if these preliminary proposals represent new entrants to competition then we would expect some lag in those later-stage metrics. Should this development persist, it would be interesting to see if there is any effect on the representation gap between PUIs in preliminary proposals and DEB Core Programs awards. This gap is something that would likely be worth a deeper examination in the future.
Concluding Thoughts
Since the implementation of the preliminary proposal system in January 2012, we have not seen major departures from pre-2012 trajectories across measures of our portfolio with respect to PI or institution demographics or collaborations. Four years in, we have not seen indication of Division wide changes, especially any worsening of submission and award proportions among any of these major groups of concern. Success rates appear stable across multiple years for the first time in recent memory. However, the overall climate for awards remains poor due to continued funding stagnation. If there is any bright side to that fact, funding woes at least appear to not have been amplified for any particular subgroup in recent years. But, the limited purchasing power of program budgets means our ability to support the full diversity of the research community will continue to be tested and subject to difficult trade-offs.
[i] During the 13 years before preliminary proposals, DEB Core Program award numbers fluctuated quite a bit; they regularly rose or fell by 20-30 (and as many as 80!) awards per year.


Data Sketches, a monthly visualization matchup

Data Sketches, a collaboration between Nadieh Bremer and Shirley Wu, aims to visualize a monthly topic in two different ways.
Each month, we choose a topic and aim to have a visualization completed by the end of the month. Within the topic, we’re free to do whatever we want; a perfect opportunity to create, experiment, and have fun. The collaboration also gives us an encouraging sounding board, and a motivating pressure: a mutual reluctance of letting the other down.
They’re four months into the project with some fun results, and it’s a good example of how similar things can be shown in very different ways.
Tags: collaboration, contrast
Posted by in collaboration, contrast, Data Art
Program Announcement: DEB Core Programs & LTREB Solicitations Updates
Updated guidelines are now available for submissions under the two-stage DEB preliminary/full proposal system. Both DEB Core Programs and Long Term Research in Environmental Biology (LTREB) have been updated.
The new DEB Core Programs publication is NSF 17-512[i].
The new LTREB publication is NSF 17-513[ii].
Please read these guidelines if you plan to submit a preliminary proposal.
In this post, we’re providing a brief summary of the notable points and key changes, but this is not sufficient information to complete a submission.
Both solicitations
- The definition of “Eligible Institutions” has been updated with limits on the eligible institution types. Institution types that do not meet this definition remain eligible as sub-awardees, but cannot be the primary grant recipient.
- The deadline for submitting the Personnel List Spreadsheet (from a template, submitted by email) has been reduced to 1 business day (from 3 days) after the proposal deadline for both preliminary and full proposals.
- The purpose and procedures for requesting a full proposal deferral have been updated and clarified.
- The requirement for full proposals to provide results of prior NSF support has been clarified and emphasized.
- The guidelines for Letters of Collaboration (to confirm cooperation or involvement of persons or organizations not receiving funding under the proposal) have been updated to clarify the purpose of, and limits on, such letters.
DEB Core Programs
- The Core Programs solicitation now includes instructions for submission of international collaborative proposals involving eligible collaborators in the UK (via NERC) or Israel (via BSF). These instructions continue the partnerships originally advertised as Dear Colleague Letters.
- The budget cap for the small grants (SG) option has been increased to $200,000.
LTREB
- The Project Description page limit for RENEWAL proposals has been increased from 8 to 10 pages.
Changes Beyond the DEB Solicitations
IOS
Many of our PIs have research interests that overlap between DEB and the Division of Integrative Organismal Systems (IOS). New submission guidelines for the preliminary proposal system in IOS have also been published as NSF 17-508. Check with IOS and the IOS Blog for additional information.
NSF-wide
Please take note that the NSF general proposal guidelines have also been revised. This information is provided in the NSF Proposal & Award Policies & Procedures Guide (PAPPG), which previously comprised two publications known as the Grant Proposal Guide (GPG) and Award & Administration Guide (AAG). The new version of the PAPPG, is a single consolidated guide: NSF 17-1. The guidelines in PAPPG 17-1 apply for proposals submitted or due, or awards made, on or after January 30, 2017. This document contains the full set of general guidelines to PIs, including everything from proposal preparation to award reporting and close-out.
A summary explanation of the new PAPPG format and changes from the previous edition of the guide can be read here: https://www.nsf.gov/pubs/policydocs/pappg17_1/sigchanges.jsp
These revisions have minimal effect on the requirements for the upcoming DEB preliminary proposal deadline (since the PAPPG comes into force on Jan 30, 2017 – a week after the pre-proposal deadline).
The guidelines in PAPPG 17-1 will apply for invited full proposals (due next August), and other proposals you may be planning to submit to DEB or other NSF programs.
For instance, starting on Jan, 30 2017 any RAPID or EAGER proposals intended for DEB would list the NSF 17-1 PAPPG program announcement number on the proposal cover page.
[i] The old solicitation NSF 15-609 is no longer accepting new proposals.
[ii] The old solicitation NSF 16-500 is no longer accepting new proposals.


DEB Numbers: Historical Proposal Loads
Last spring we posted on the per-person success rate and pointed out several interesting findings based on a decade of DEB data. We were seeing a lot of new PIs and, conversely, a lot of PIs who never returned after their first shot. And, the vast majority of PIs who managed to obtain funding are not continuously funded.
This post is a short follow-up to take a bigger picture look at submission rates.
Since preliminary proposals entered the scene, DEB really hasn’t seen much change in the submission pattern: 75% of PIs in any year submit one preliminary proposal and the other 25% submit two (and a small number submit three ideas in a year, if one also counts full proposals to special programs).
Before the preliminary proposals were launched, we ran some numbers on how often people tended to submit. The results were that, in the years immediately prior to preliminary proposals (~2008-2011), around 75% of PIs in a year were on a single proposal submission (25% on two or more). Fewer than 5% of PIs submitted more than two proposals in a year. Further, most PIs didn’t return to submit proposals year after year (either new ideas or re-working of prior submissions); skipping a year or two between submissions was typical. These data conflicted with the perceptions and anecdotes that “everyone” submitted several proposals every year and were increasing their submission intensity. Although recent data don’t support those perceptions, we still wondered if there might be a kernel of truth to be found on a longer time scale. What is the bigger picture of history of proposal load and submission behavior across BIO?
Well, with some digging we were able to put together a data set that lets us take a look at full proposal research grant submissions across BIO, going all the way back to 1991 when, it seems, the NSF started computerized record-keeping. Looking at this bigger picture of submissions, we can see when changes have occurred and how they fit into the broader narrative of the changing funding environment.

Total BIO full research grant submissions per year (line, right axis) and proportions of individuals submitting 1, 2, 3, 4, 5, or more proposals each calendar year from 1991 to 2014. (Note: 2015 is excluded because proposals submitted in calendar year 2015 are still being processed at the time of writing.)
1990s: Throughout the 1990s BIO received about 4000 proposals per year. This period of relative stability represents the baseline for more than a decade of subsequent discussions of increasing proposal pressure. Interestingly, the proportion of people submitting two or more proposals each year grew over this period, but without seeming to affect total proposal load; this could result from either increasing collaboration (something we’ve seen) or a shrinking PI pool (something we haven’t seen). At this time NSF used a paper-based process, so the cost and effort to prepare a proposal was quite high. Then….
2000s: In 2000, FastLane became fully operational and everyone switched to electronic submission. BIO also saw the launch of special programs in the new Emerging Frontiers division. In a single year, it became easier to submit a proposal and there were more deadlines and target dates to which one could potentially submit. The new electronic submission mechanism and new opportunities likely both contributed to increased submissions in subsequent years.
Following the switch to FastLane, from 2001 to 2005, total annual submissions grew to about 50% above the 1990s average and stayed there for a few years. This period of growth also coincided with an increasing proportion of people submitting 2+ proposals. Increasing numbers of proposals per person had only a limited effect on the total proposal load because of continued growth in collaboration (increasing PIs per proposal). Instead, the major driver of proposal increases was the increasing number of people submitting proposals. This situation was not unique to BIO.
This period from 2001 to 2005 was the rapid growth that sparked widespread discussion in the scientific community of overburdening of the system and threats to the quality of merit review, as summarized in the 2007 IPAMM report.
Eventually, however, the community experienced a declining success rate because BIO budgets did not go up in any way to match the 50% increase in proposal submissions. From 2005-2008 submissions/person seemed to stabilize and submissions peaked in 2006. We interpret this as a shift in behavior in response to decreasing returns for proposal effort (a rebalancing of the effort/benefit ratio for submissions). It would have been interesting to see if this held, but….
2009/2010: In 2009 and 2010, BIO was up another ~1000 proposals over 2006, reaching an all-time high of nearly 7000 proposal submissions. These were the years of ARRA, the economic stimulus package. Even though NSF was very clear that almost all stimulus funding would go toward funding proposals that had been already reviewed (from 2008) and that we wouldn’t otherwise be able to afford, there was a clear reaction from the community. It appears that the idea of more money (or less competition) created a perception that the effort/benefit relationship may have changed, leading to more proposals.
2011: We see a drop in 2011. It is plausible that this was the realization that the ARRA money really was a one-time deal, there were still many more good proposals than could be funded, and that obtaining funding hadn’t suddenly become easier. As a result, the effort/benefit dynamic could be shifting back; or, this could’ve been a one-time off year. We can’t know for sure because…
2012: Starting in 2012 IOS and DEB, the two largest Divisions in BIO, switched to a system of preliminary proposals to provide a first-pass screening of projects (preliminary proposals are not counted in the chart). This effectively restricted the number of full proposals in the two largest competitions in BIO such that in 2012, 2013, and 2014 the full proposal load across BIO dropped below 5000 proposals per year (down 2000 proposals from the 2010 peak). The proportion of individuals submitting 2+ full proposals per year also dropped, consistent with the submission limits imposed in DEB, IOS, and MCB. PIs now submitting multiple full proposals to BIO in a given year are generally submitting to multiple programs (core program and special program) or multiple Divisions (DEB and [IOS or MCB or EF or DBI]) and diversifying their submission portfolios.
In summary, the introduction of online and multi-institutional submissions via FastLane kicked off a decade of change marked by growth in proposal submissions and per-PI submissions to BIO. The response, a switch to preliminary proposals in IOS and DEB, caused a major (~1/3) reduction in full proposals and also a shift in the proportion of individuals submitting multiple proposals each year. In essence, the pattern of proposal submission in BIO has shifted back to what it was like in the early 2000s. However, even with these reductions, it is still a more competitive context than the 1990s baseline, prior to online submissions via FastLane.


Posted by in collaboration, core programs, DEB Numbers, Discussion Forum, preliminary proposals
DEB Numbers: FY2015 Wrap-Up
Fiscal year 2015 has come to a close. With the dust settled, we can crunch the numbers on the DEB Core Program merit review and funding outcomes.
This post follows the format we’ve used in previous years. For a refresher, and lengthier discussions of the hows and whys of the metrics, you can visit the 2014 and 2013 numbers.
Read on to see how 2015 compares.
FY2015 Summary Numbers
The charts below all reflect proportions of DEB Core Program projects through each stage of the review process: preliminary proposals, full proposals, and awards.
In the review process leading to awards in FY2015:
DEB reviewed 1590 preliminary proposals received under the DEB Core Programs solicitation and LTREB solicitation in January 2014, about 25% of which were invited to the full proposal stage.
The preliminary proposal invitees were joined at the full proposal stage by 1) Direct submissions to DEB under the CAREER, OPUS, and RCN solicitations, and 2) Projects shared for co-review by another NSF program. Altogether 510 full proposals were reviewed in DEB during October and November of 2014.
From this pool of full proposals, DEB made awards to 131 projects (technically, these were 193 separate institutional awards but for analysis purposes we count collaborative groups once, i.e., as a single proposed project).
Below, we present and discuss the Division-wide success rate and some selected project demographics that were raised as concerns coming in to the preliminary proposal system. The demographic numbers are presented as proportions for comparison across the review stages. However, the progressive reduction in size of the denominators from preliminary proposals (1590) to awards (131) means each step becomes more sensitive to small absolute changes.
Success Rate
The success rate for research proposals in the DEB Core Programs remains much as it was since the preliminary proposal process was instituted; success rate is a function of the number and size of requests submitted by the research communities and appropriated funding levels.
Reminder: Elevated success rates (in grey) were due to:
- a one time ~50% increase in funding for FY2009 (the ARRA economic stimulus funding) without which success would have been ~13-15%; and,
- a halving of proposal submissions in FY2012 (the first preliminary proposal deadline replaced a second full proposal deadline for FY2012), without which success would have been ~8-9%.
Individual and Collaborative Projects
As seen in the figure below, there was little year-to-year change in the submission and funding success of single investigator projects.
 While the proportion of single investigator preliminary proposals declined slightly, there was no decrease when it came to either full proposals or awards. As a reminder to readers: most of the apparent increase in the proportion of single investigator projects between the preliminary proposal and full proposal stages is because the primarily single-investigator proposals in the CAREER and OPUS categories are not subject to the preliminary proposal screen and thus they make up a relatively larger portion of the full proposals. Similarly, the absence of CAREER and OPUS proposals at the preliminary proposal stage depresses the single investigator proportion of the preliminary proposal counts relative to the historical full proposal baseline.
The proportion of collaborative proposals in our award portfolio declined slightly from last year’s peak but is still above other prior years and doesn’t reverse the general upward trend over the past decade or so.
Readers may notice that the collaborative and single-investigator groupings don’t sum to 100%. The remainders are intra-institutional multi-PI arrangements; such projects are intellectual collaboration to be sure, but not a collaborative project per the NSF definition.
Early Career Scientists
As we discussed in the FY2013 Wrap-up, there are several imperfect metrics for identifying early career investigators, with the “Beginning Investigator” check-box on the cover page being the most immediately visible but also the most inconsistently applied identifier. Beginning Investigator includes everyone who has never received federal funding, and many researchers don’t, so it is not as directly related to career stage as we may want to think it. For the purposes of measuring “Beginning Investigators” we use the response in the BIO Classification Form (this poses the same question as the cover page but captures a more complete record of response than a single a check box).
 According to the classification form data, beginning investigators continue to receive awards in proportion to full proposal submissions but consistently represent a smaller segment of the proposal pool at these later stages than at the preliminary proposal stage[i].
The better identifier of researcher career stage is the years since PhD of the PI.
 Little changed in the profile of submitter and awardee degree ages from 2013 through 2015. Success rate does not improve markedly with degree age and generally stays between 20-30% up through 35 years post PhD. PIs more than 35 years post-PhD are typically less than 5% of the total PIs on proposals and awards: too few in number to read much into the data. Early-, mid-, and later-career PIs appear to be faring equally well in core program award decisions.
Gender & Predominantly Undergraduate Institution (PUI) Status
Last year we saw what seemed like a potentially spurious but also curious pair of year to year changes in these groups: the proportion of PUI awardees jumped up at the same time as the proportion of female PIs slumped.
We thought these changes were spurious because the absolute numbers involved were small and potential confounding factors were numerous. That is, there are a range of factors beyond the summary rating of the panel such as nuances of the reviewer input, other demographic characteristics, additional funding, overlap with others’ awards, past productivity, etc., that weigh into each award decision. If only a few proposals satisfy any one factor, even fewer proposals will satisfy combinations of factors. Thus, a decision to make an award that boosts one aspect of portfolio diversity may come with an opportunity cost of not addressing another aspect.
We thought this was curious because, with PUIs experiencing a notable jump and female PIs a notable drop, these stood out visually from other results and related to preexisting areas of concern. And, this year we see another big change but in the opposite direction.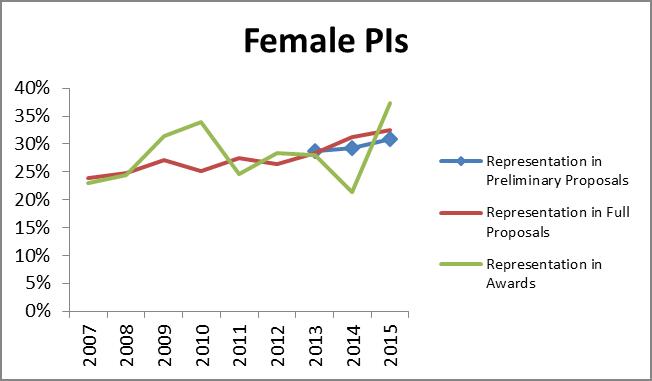

The first key thing to note is that there is no surprising up or down change in submissions of preliminary proposals or full proposals in either group since before the preliminary proposal system. That doesn’t take away, however, from the sudden appearance of negative reciprocal changes between award proportions for these two demographics seen in FY2014 and FY2015. On the other hand, there’s no trend (just greater variation), and there’s no direct mechanism we’ve been able to identify that would lend itself to management or modification.
Since the differences emerge only at the award stage, we continue to view this as we did last year. Since we don’t see a similar effect from preliminary proposal review and invitation decisions (yielding the full proposals), it seems likely that this is directly related to the final decisions regarding use of limited funds across too many strong candidates.
We conclude that we are witnessing a small numbers effect; 131 awards is simply not a sufficiently large “sample” to be representative of the population across all of the potential decision-making variables and concerns. PUIs are a minority component of the proposal pool (~18%). Female PIs are a minority component of the proposal pool (~30%). Beginning Investigators are a minority component of the proposal pool (~20%). Proposals that fall into two categories are an even smaller fraction of the proposal pool (~6%) and proposals that fit into all three are even smaller yet (~1%).
Concluding Thoughts
Since the implementation of the preliminary proposal system in January 2012, we have not seen major departures from pre-2012 trajectories across these measures of our portfolio with respect to PI or institution demographics or collaborations. Three years in, we have not seen indication of Division-wide changes, especially any worsening of submission and award proportions among any of these major groups of concern. Success rates appear stable across multiple years for the first time in recent memory. However, the overall climate for awards remains poor due continued funding stagnation. If there is any bright side to that fact, funding woes at least appear to not have been amplified for any particular subgroup in recent years. But, the limited purchasing power of program budgets means our ability to support the full diversity of the research community will continue to be tested and subject to difficult trade-offs.
[i] Two points we shared in our post from this past spring on individual success rates come to mind: the first years of the preliminary proposal system have seen a large uptick in first-time submitters, and only 25% of individual PIs received any funding from DEB over a 9-year period examined in that post. Lots of PIs have never, and will never, receive funding from us. In the context of the result above, we see the learning curve. There is a high failure rate: especially among PIs without prior funding success, but even among those who have been successful in the past. While a successful preliminary proposal from a would-be first-time PI goes on to compete on even footing with full proposals from experienced PIs, we don’t expect the preliminary proposals from all unfunded PIs to have the same distribution across the quality spectrum as those from previously successful PIs.


Introducing PLOScast: a podcast on science, academia and the future of scholarship

We are pleased to introduce a new PLOS blog called PLOScast*. PLOScast is a regular podcast dedicated to interviews with innovators and thought leaders on scholarly publishing developments, the future of academia and the changing
The post Introducing PLOScast: a podcast on science, academia and the future of scholarship appeared first on PLOS Blogs Network.
Posted by in cameron neylon, collaboration, featured, open science, peer review, Podcast