Shifting currents and melting ice in the Antarctic

Based on data from autonomous sensors floating in the oceans, researchers are able to model the flows and characteristics of ocean currents in more detail than ever before. For The New York Times, Henry Fountain and Jeremy White show how the shifts have unwelled centuries-old water deep in the ocean, which releases carbon into the air.

The scrollytelling format of this piece works well to show sensor estimates over time. You get a sense of the currents without needing to see animated lines.

Tags: , , , , ,

Preventing Prescription Opioid Overdoses in New York State

A pile of prescription medicine bottles.

Like many states, New York is suffering from the consequences of the opioid overdose epidemic. There has been a dramatic increase in the number of overdoses due to both prescription and illicit drug use in recent years. Overdoses are killing people of all races and ages. The New York State Department of Health (NYSDOH) is coordinating statewide prevention interventions to save lives and prevent opioid overdoses.

Adapting the RxAwareness Campaign for New York State

Tamera's Rx Awarness story
The Rx Awareness campaign videos tell the real stories of people whose lives have been negatively impacted by prescription opioid use and abuse.

The NYSDOH’s Prescription Drug Overdose Prevention Program is using the CDC RxAwareness Campaign. The campaign ran from February 2018 to June 2018. This is an evidence-driven prescription opioid overdose prevention campaign that tells the real stories of people whose lives have been torn apart by opioid use and abuse.  The campaign aims to:

  • Increase everyone’s awareness that opioids can be addictive and dangerous
  • Increase the number of individuals that choose options other than opioids for safe and effective pain management
  • Decrease the number of individuals who use opioids for non-medical or recreational reasons

NYSDOH is using six 30-second testimonial video ads and five 30-second radio ads featuring people and families affected by prescription opioid abuse and overdose. This campaign includes Facebook ads, popular website display banners, streaming audio, and Google Search ads. Web banner ads and online search ads designed and audience tested by CDC were also used.

Real-time Monitoring Makes a Difference

The beauty of digital marketing is that it allows for real-time monitoring and optimization. The NYSDOH monitored two key metrics from the campaign every week:

  1. Click-through rates (CTR): the ratio of people who clicked on an ad compared to the total number of people who viewed the ad.
  2. Cost-per-click (CPC): the price that is paid for each click on the ad.

Continuously assessing the performance of individual ads allowed NYSDOH to swap out lower performing ads for higher performing ads. For example, mobile placements were showing strong performance, so more of the budget was allocated towards these placements and the budget for lower performing ads was reduced. High performance ads have greater reach, which leads to greater impact and increases the likelihood that the campaign will achieve its goals.

Evaluation Findings Help NY Maximize their Ad Budget

NYSDOH learned several things through real-time monitoring and evaluation:

  • Overall, women are spending nearly twice as long as men on the DOH campaign website, www.health.ny.gov/rxawareness
  • Adults 35 to 54 years old have a stronger click-through rate than the adults who are 35 to 54 years old and parents of teenagers
  • Banners on one weather site currently have the highest click-through rates and have resulted in the longest average time spent on the landing page
  • The click-through rates of online search ads increased consistently from May – June 2018
  • Public commenting on ads help NYSDOH understand how the campaign is being accepted

The NYSDOH continues to evaluate activity in this campaign. NYSDOH will utilize these findings in future campaigns.

Learn more:

This communication campaign was supported by the Cooperative Agreement Number, 5 NU17CE002742-03, funded by the Centers for Disease Control and Prevention. Its contents are solely the responsibility of the authors and do not necessarily represent the official views of the Centers for Disease Control and Prevention or the Department of Health and Human Services.

We want to hear from you!

Leave a comment below and share how you are monitoring and evaluating your digital campaigns.

The Communication Research and Evaluation blog series highlights innovative research and evaluation methods used at CDC to improve behavior change campaigns. In the coming months we will look at other examples.

All the buildings in Manhattan in 3-D map

Taylor Baldwin mapped all of the buildings in Manhattan using a 3-D layout. Rotate, zoom, and pan, and be sure to mess around with the parameters in the control panel for different looks. Also make sure you try it in Chrome, because it’ll probably send your computer fan whirling.

Tags: , ,

PulseNet key to solving 2010 E. coli outbreak linked to lettuce

PulseNet key to solving 2010 E. coli outbreak linked to lettuce | www.APHLblog.org

by Kim Krisberg

On April 22, 2010, federal public health officials notified the New York State Department of Health of two E. coli clusters at colleges in Michigan and Ohio. The very next day, the New York agency got word of an illness cluster in its own state with symptoms similar to the neighboring outbreaks.

Fortunately, that initial notification came via PulseNet, the national molecular subtyping network for foodborne disease surveillance, which allows public health scientists and investigators to rapidly identify foodborne illness outbreaks. That meant staff at the New York State public health laboratory, officially known as the Wadsworth Center, had easy access to Michigan’s and Ohio’s laboratory findings, which allowed immediate testing to begin to discover whether the New York illnesses were connected to the larger outbreak. Just a handful of days later, the New York lab had an answer — DNA fingerprints from patient specimens in Michigan, Ohio and New York were a match. The E. coli O145 outbreak had spread to New York.

“It was invaluable for us,” said Madhu Anand, DrPH, deputy director of the Regional Epidemiology and Investigations Program in the department’s Bureau of Communicable Disease Control, of PulseNet, which celebrated its 20th anniversary last year. “PulseNet was critical at every stage of this investigation.”

Just a few days following identification of the initial New York illness cluster, which occurred at a college in western New York, public health staff got word about a cluster of hemolytic uremic syndrome (HUS) illnesses in a school district just north of New York City. HUS is a potentially life-threatening complication associated with Shiga toxin-producing E. coli infection. Public health workers began active surveillance in the district, Anand said, finding multiple cases that matched the profile of cases connected to the E. coli outbreak.

Around this same time, CDC announced that epidemiologic and traceback investigations in Michigan and Ohio pointed to shredded romaine lettuce from a single distributor as the culprit. In response, the New York State Department of Health worked with local public health to collect any leftover lettuce from the college. The college didn’t have any leftovers, said David Nicholas, MPH, research scientist and epidemiologist in the state’s Bureau of Community Environmental Health and Food Protection, but it did have an invoice, which showed the same distributor identified in Ohio and Michigan. Public health staff also sought out lettuce leftovers in the affected school district, and they found plenty.

On April 28, 2010, the Wadsworth Center received more than 150 pounds of shredded lettuce from the school district — or what Nicholas described as a “Honda full of lettuce.” Lab staff got to work testing portions of the entire lot, which were divided into two-pound bags, reported Nellie Dumas, associate director of the Wadsworth Center’s Bacteriology Laboratory. However, one of the two-pound bags was stamped with an expiration date indicating it could have been among the same batch of shredded lettuce that the sickened children had eaten. That expiration date led lab staff to test the entire two pounds of lettuce, Dumas said.

In testing that particular bag of lettuce, laboratorians were able to isolate E. coli O145, which was then tested by pulsed-field gel electrophoresis (PFGE) to obtain a DNA fingerprint. The DNA fingerprint matched the outbreak strains identified in Ohio and Michigan. The Wadsworth findings were then uploaded to PulseNet, helping to confirm that shredded lettuce was indeed the source of the outbreak, said Deborah Baker, research scientist in the Wadsworth Center Bacteriology Laboratory.

“PulseNet was vitally important because it allowed states to instantly share subtyping information,” Baker said. “As soon as we have a PFGE pattern, we can immediately go into the database and see what’s happening in other states.”

Overall, according to Anand, New York state was home to six confirmed cases and one probable case of E. coli O145 connected to multistate outbreak traced back to shredded lettuce. All six confirmed patients had to be hospitalized and four developed HUS. Nationwide, according to CDC, 26 confirmed and seven probable cases of illness were connected to the E. coli outbreak in five states: Michigan, New York, Ohio, Tennessee and Pennsylvania. (The cases in Tennessee and Pennsylvania were identified in retrospect using PulseNet data.) Among the 30 E. coli patients with available information, 40 percent became so sick they had to be hospitalized. Thankfully, no deaths occurred.

A May 10, 2010 news release from the U.S Food and Drug Administration linked the contaminated shredded lettuce back to Freshway Foods in Ohio. The company issued a voluntary recall.

“For 20 years, PulseNet has helped us find the sources of these horrific illnesses,” said Dumas, associate director of the Wadsworth Center Bacteriology Laboratory. “It’s total teamwork.”

According to CDC, PulseNet identifies about 1,500 clusters of foodborne illness every year, about 250 clusters that cross state lines, and about 30 multistate outbreaks traced back to a food source. A recent economic evaluation of PulseNet found that every year, the laboratory network prevents more than 266,500 illnesses from Salmonella, nearly 9,500 illnesses from E. coli and 56 from Listeria. That translates into $507 million in reduced medical and productivity costs.

The post PulseNet key to solving 2010 E. coli outbreak linked to lettuce appeared first on APHL Lab Blog.

Cell reception on the subway, mapped

Subspotting

Daniel Goddemeyer and Dominikus Baur grew interested in cell reception while on the New York subway:

In recent years, the MTA has started to equip select stations with WiFi and cell phone transmitters, but due to the remaining lack of connectivity in the tunnels, passengers rely on stray signals from surface transmitters to send or receive messages in between stations.

So they traveled the lines, collected data, and mapped out their results.

Tags: , ,

Riders cross park land created by landfill that was dumped into…


Riders cross park land created by landfill that was dumped into Jamaica Bay, New York, 1979. Photograph by David Alan Harvey, National Geographic Creative

Legionnaire’s in 2015: Cutting Edge Research Clashing with Public Health Unpreparedness

By Meredith Wright In 1976, the American Legion, a veterans group still active today, met in Philadelphia, PA for a three-day convention. Shortly after the convention ended many of the Legionnaires became ill. By the end of the outbreak, 182 … Continue reading »

The post Legionnaire’s in 2015: Cutting Edge Research Clashing with Public Health Unpreparedness appeared first on PLOS Blogs Network.

On Broadway shows city life through data cross-sections

On Broadway

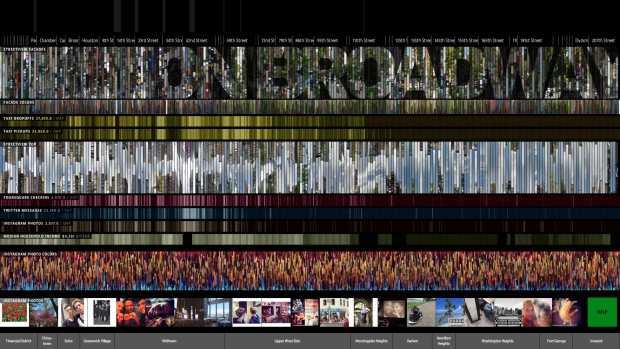
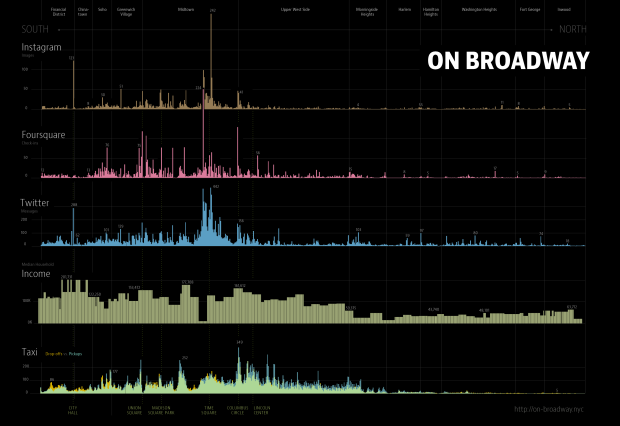
On Broadway, by Daniel Goddemeyer, Moritz Stefaner, Dominikus Baur, and Lev Manovich, provides a slice-by-slice view of the street that goes through Manhattan. Instead of a map like you might expect from such a project, the piece uses "a visually rich image-centric interface, where numbers play only a secondary role."

You start with an overview of 13 layers, where each layer represents a dataset. It is a mix of images from Google Street View, which provide a sense of buildings and skyline, and Instagram photos, which provide a sense of the people who move through the street. In between you get layers that represent taxi pickups, median household income, and other demographics.

Completely abstracted, you have a view of two distinct sections of Broadway. Peaks on the left and a low plateau on the right.

Broadway data strip

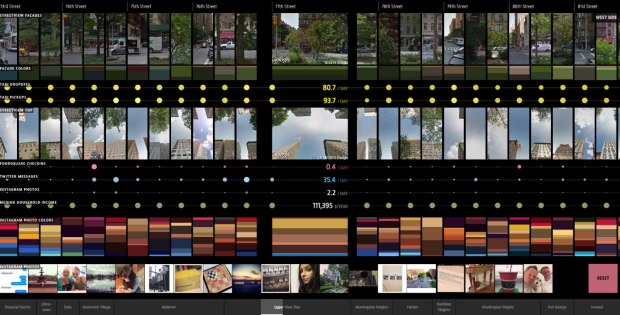
Zoom in and you see these vertical slices. Each represents a location.

Zoomed in

There's a lot to explore, so have a look yourself. I suggest a modern browser, a large screen, and a mouse or touchpad that lets you scroll left to right to maximize the experience. I found myself flicking the view left to right and back again just to play with the interface. For so many images, everything moves and loads relatively quickly, which is important in getting that feeling of sprinting through the city.

Good stuff all around.

On Broadway is also on display at the Public Eye exhibition at New York Public Library until January 3, 2016.

Tags: , ,

A women’s water ski team lifts skis while being towed at…


A women’s water ski team lifts skis while being towed at 23 mph on Darts Lake in New York, 1956.Photograph by Robert Sisson, National Geographic Creative